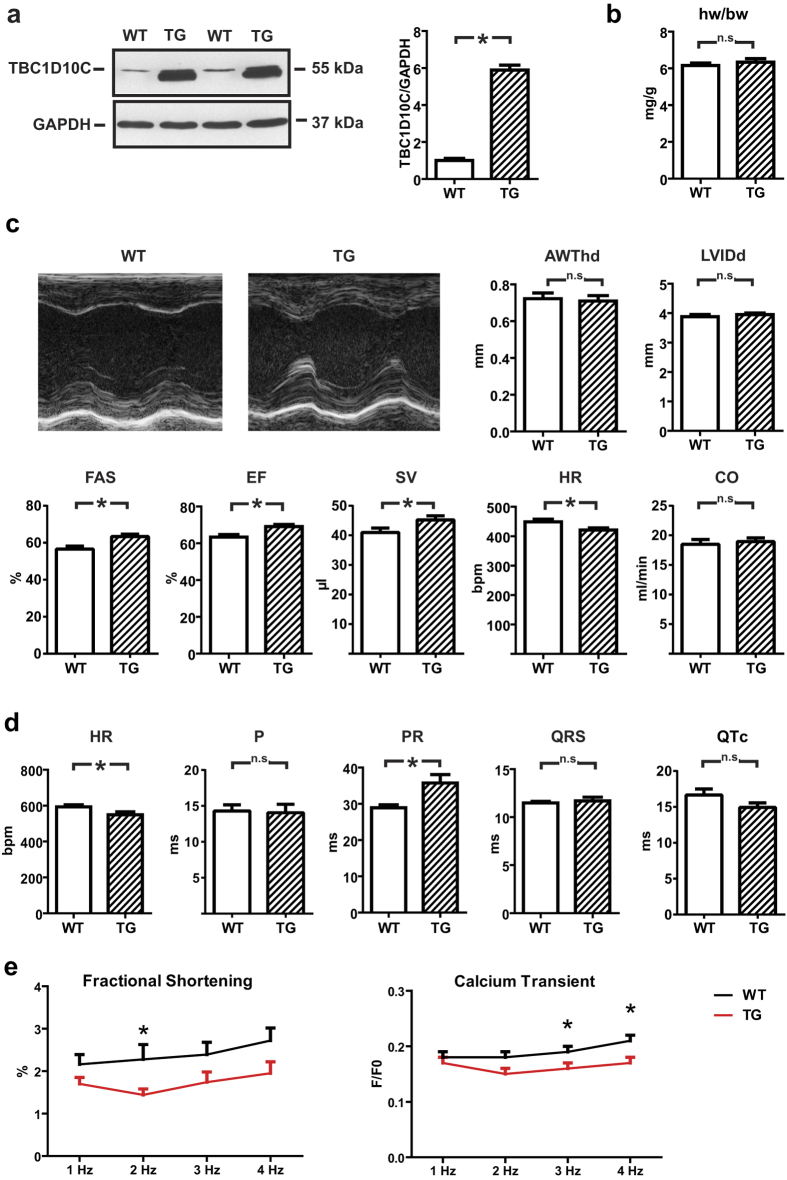
Figure 1. Phenotype of TBC1D10C TG mice.
(a) Western blot displaying overexpression levels of TBC1D10C in WT vs. TG mice in myocardial tissue (n = 4). The full length membrane of this cropped blot is displayed in Supplemental Fig. 6. (b) Heart weight to body weight ratio (hw/bw) (WT: n = 16, TG: n = 12; n.s.). (c) Echo-cardiography in 9-week-old mice revealed similar anterior wall thickness (AWThd) and left ventricular inner diameter (LVIDd), significantly increased fractional area shortening (FAS), ejection fraction (EF), stroke volume (SV), reduced heart rate (HR) and similar cardiac output (CO) in the TG (WT: n = 33, TG: n = 39 mice; P < 0.05). (d) Telemetric ECG recordings in conscious mice confirmed significantly reduced heart rate (HR) and revealed a prolonged PR interval and equal QRS and QTc intervals in TBC1D10C TG vs. WT mice (n = 7 per group; P < 0.05). (e) Fractional shortening (left) and calcium transient measurements in isolated left ventricular cardiomyocytes from WT and TG mice (n = 7 mice per group, 6–10 cells each; P < 0.05; two-way ANOVA).

