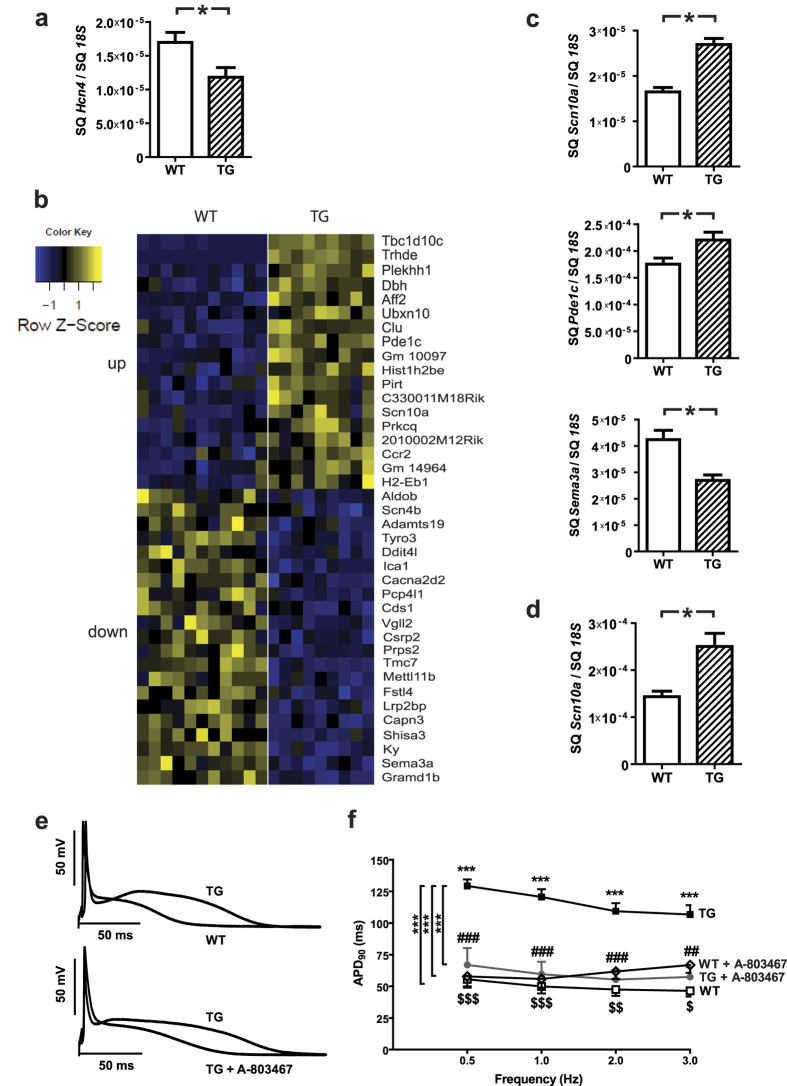
Figure 6. Transcriptome analysis in TBC1D10C TG mice.
(a) Hcn4 expression levels were significantly reduced in TG vs. WT (n = 16 per group; P < 0.05). (b) Heat map of whole mRNA transcriptome analysis of TBC1D10C TG vs. WT mice at the age of 20 weeks. (WT: n = 11, TG: n = 9; log2-fold change >0.25, P(adj) < 0.05). (SQ: template starting quantity.) (c) Examples of differentially expressed genes (Scn10a, Pdc1c, Sema3a) validated by quantitative real-time RT-PCR (WT: n = 11, TG: n = 9). (d) Scn10a expression was examined also in atrial myocardium. (e,f) TBC1D10C TG mice exhibited significantly prolonged action potential duration (APD), which was completely reversed by treatment with the specific Scn10a (Nav1.8) inhibitor A-803467 (TG: n = 9 mice (27 cells); WT: n = 6 mice (21 cells); TG + A-803467: n = 4 mice (6 cells); WT + A-803467: n = 3 mice (6 cells); ***P < 0.0001; two-way RM-ANOVA and Bonferroni-post-test).

