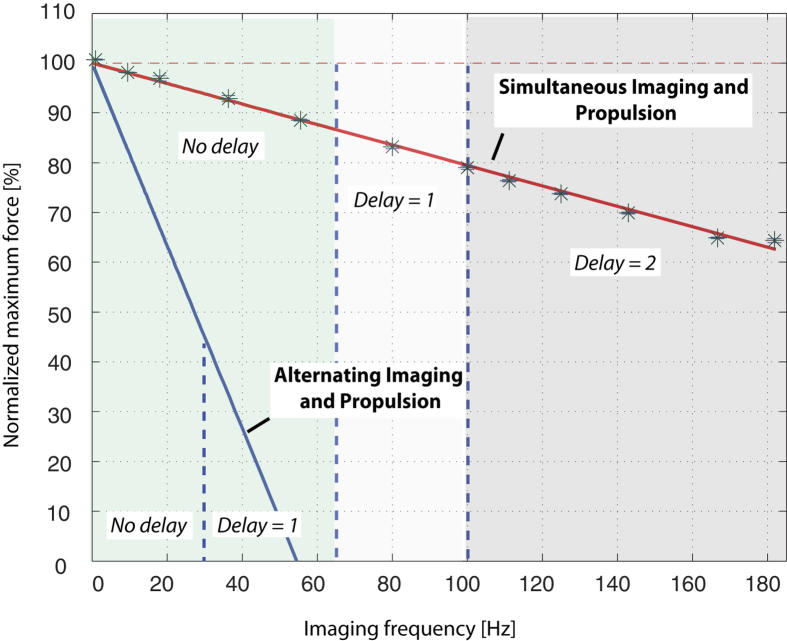
Figure 3. Maximum average force produced by sequences of Fig. 1 normalized by the maximum possible force that can be produced by the scanner.
Experimental data points are denoted by *. Dashed vertical lines separate frequency ranges according to the delay, measured in number of pulse sequences, between when an image is taken and when it is available for modulating propulsive force.

