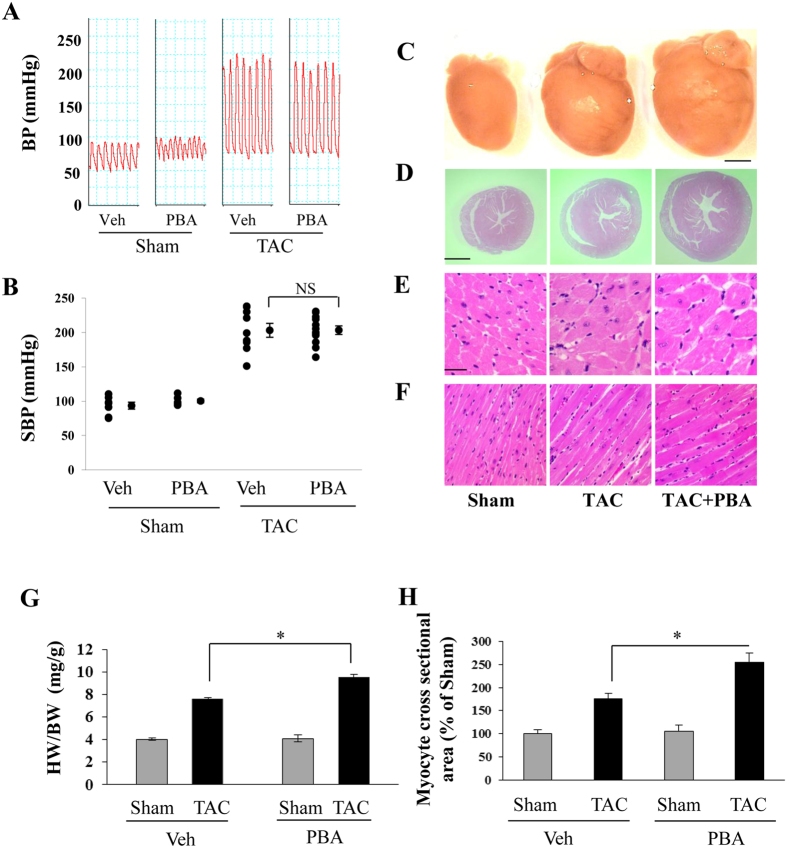
Figure 2. Effects of PBA on cardiac hypertrophy induced by pressure overload in mice.
(A) Representative recording curves of blood pressure (BP). (B) Statistical results of systolic BP (SBP) recorded from the right carotid artery by invasive cannulation with a Millar Pressure Catheter in mice subjected to sham or TAC operation with or without PBA treatment (100 mg/kg/d, ip, for 6 weeks). Sham + Veh (n = 7); Sham + PBA (100 mg/kg/d, ip, n = 6); TAC (n = 9); TAC + PBA (100 mg/kg/d, ip, n = 12). (C) Representative images of whole hearts. (D) Whole view of heart cross sections stained with haematoxylin–eosin. (E) Cross-axis view of cardiomyocytes. (F) Long-axis view of cardiomyocytes. Scale = 20 μm in D and E. (G) The ratio of heart weight (HW) to body weight (BW). (H) Cardiomyocyte cross-sectional area. In (G) TAC group (n = 22), TAC + PBA group (n = 22), Sham group (n = 8), Sham + PBA group (n = 8). In (H) four mice in each group were selected and 400 cardiomyocytes per animal were chosen randomly. Data are expressed as mean ± SEM. *P < 0.05. NS, not significant; TAC, transverse aortic constriction; Veh, vehicle.

