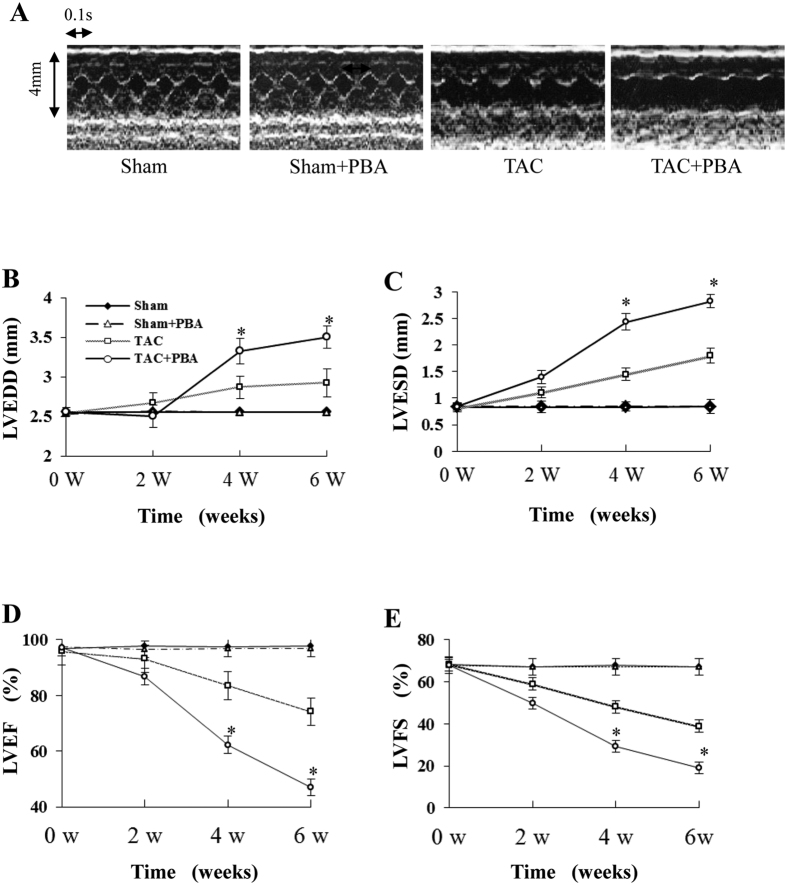
Figure 3. Time course results of echocardiographic examination of pressure-overloaded mice treated with PBA.
(A) Representative pictures of M-mode echocardiography. (B) Left ventricular end-diastolic diameter (LVEDD). (C) Left ventricular end-systolic diameter (LVESD). (D) Left ventricular ejection fraction (LVEF). (E) Left ventricular fractional shortening (LVFS). Sham (n = 10), Sham + PBA (n = 10), TAC (n = 14 at 2 w, n = 10 at 4 w and n = 7 at 6 w) and TAC + PBA (n = 20 at 2 w, n = 12 at 4 w and n = 6 at 6 w). Data are expressed as mean ± SEM. *P < 0.05 vs. the values of the same time point of the TAC group. TAC, transverse aortic constriction.

