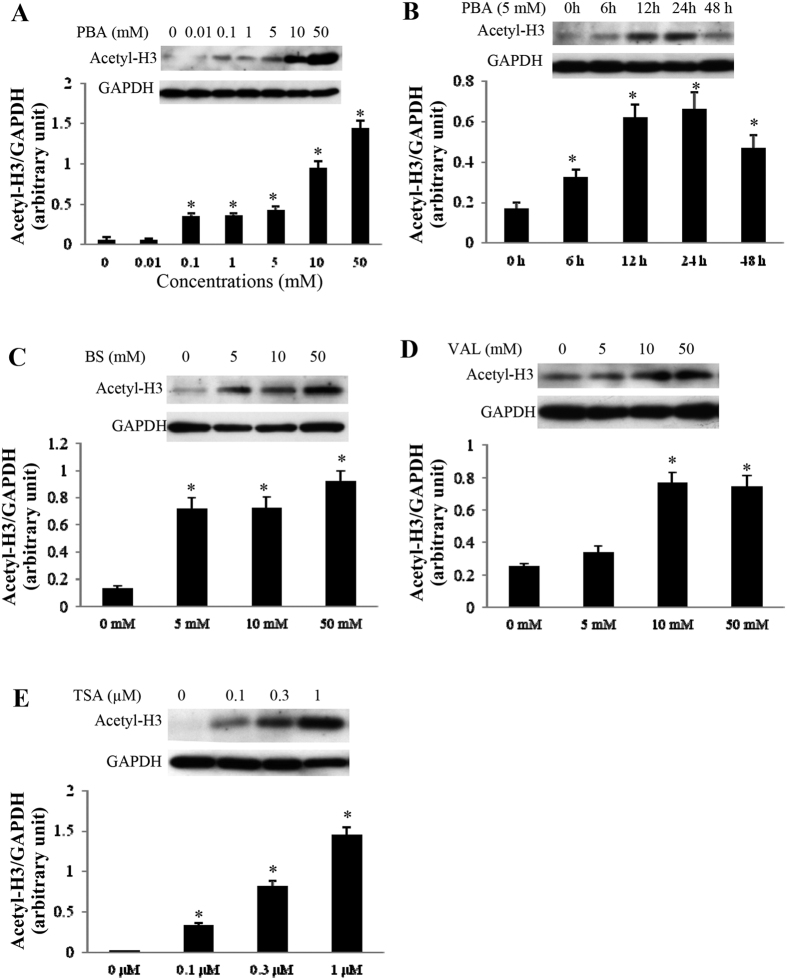
Figure 8. The effects of different HDAC inhibitors on H3 Acetylation.
(A,B) Western blots of H3 acetylation in cultured neonatal cardiomyocytes treated with different concentrations of PBA for 24 h (A) or with 5 mM PBA for different periods (0, 6, 12, 24 and 48 h) (B). n = 4 in each group. (C–E) Western blots of H3 acetylation in cultured neonatal cardiomyocytes treated with different concentrations of BS (C), VAL (D) or TSA (E) for 24 h. n = 4 in each group. Data are expressed as mean ± SEM; *P < 0.05 vs. baseline. The blots in (A–E) were cropped from Fig. S1E–I, respectively. All the gels were run under the same experimental conditions.

