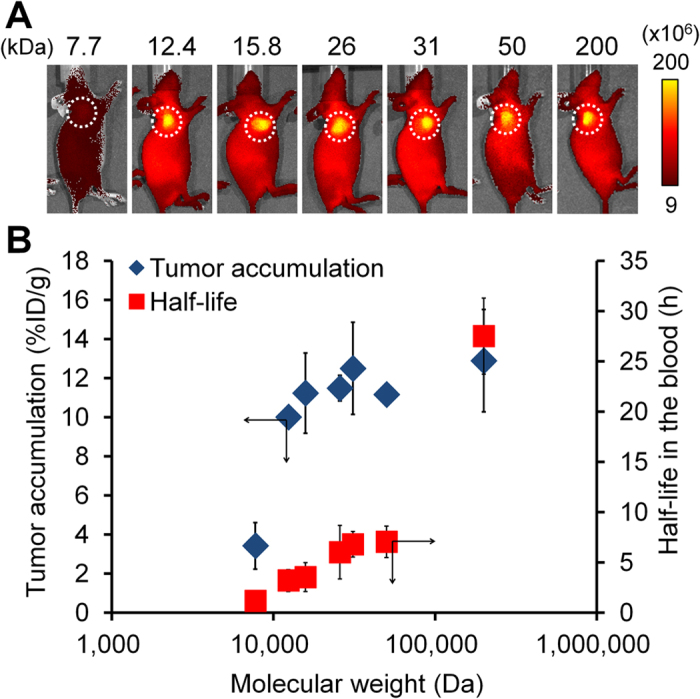
Figure 2. In vivo fluorescent measurement of POZ-ICG derivatives with different molecular weights.

(A) In vivo fluorescence imaging of tumor-bearing mice administered with POZ-ICG (left to right; P1-ICG1.1, P2-ICG1.1, P3-ICG0.9, P4-ICG0.7, P5-ICG0.8, P6-ICG1.0, and P7-ICG1.1). Dotted circles indicated the tumor regions. Scale bar units: photons/sec/cm2/steradian. (B) Tumor accumulation (%ID/g) (blue) and half-life in the blood (h) (red) of POZ-ICG.
