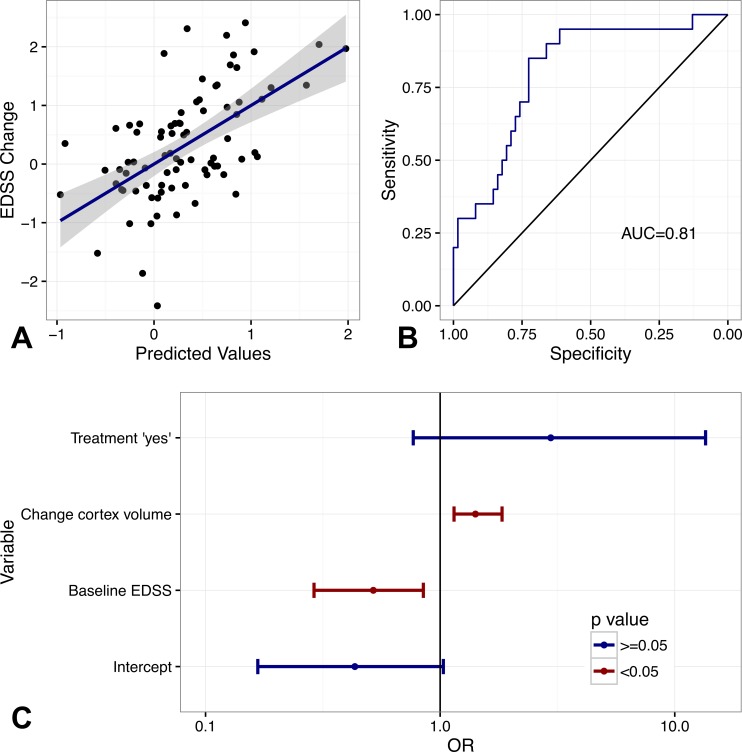
Figure 1. Predictive value of multivariate models.
(A) Predicted values (multivariate linear model) and EDSS change. Dotplots and regression estimate (blue line) including 95%-CI (grey area). (B) ROC-curves of multivariate logit model predicting EDSS progression. (C) Odds ratios (OR) and 95% CI, red, significant, blue not significant. See Table 4 as well.

