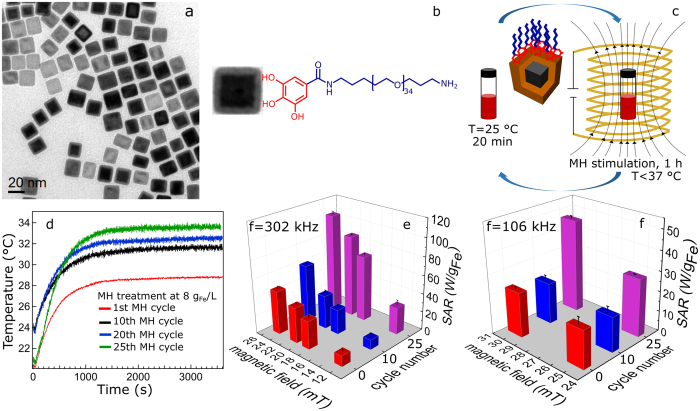
Figure 1. Magnetic stimulation treatment and SAR analysis.
(a) Typical low resolution TEM micrograph of as-synthesized core-shell nanocubes, (b) scheme of gallic-PEG-NH2 coated core-shell nanocube, (c) schematic representation of a MH treatment cycle, (d) heating profiles of PEG coated nanocubes vs. MH cycle number (particles concentration fixed at 8 gFe/L), (e,f) the temporal evolution of the SAR over 25 MH treatment cycles as a function of magnetic fields measured at two fixed frequencies of 302 (e) and 106 (f) kHz, respectively.

