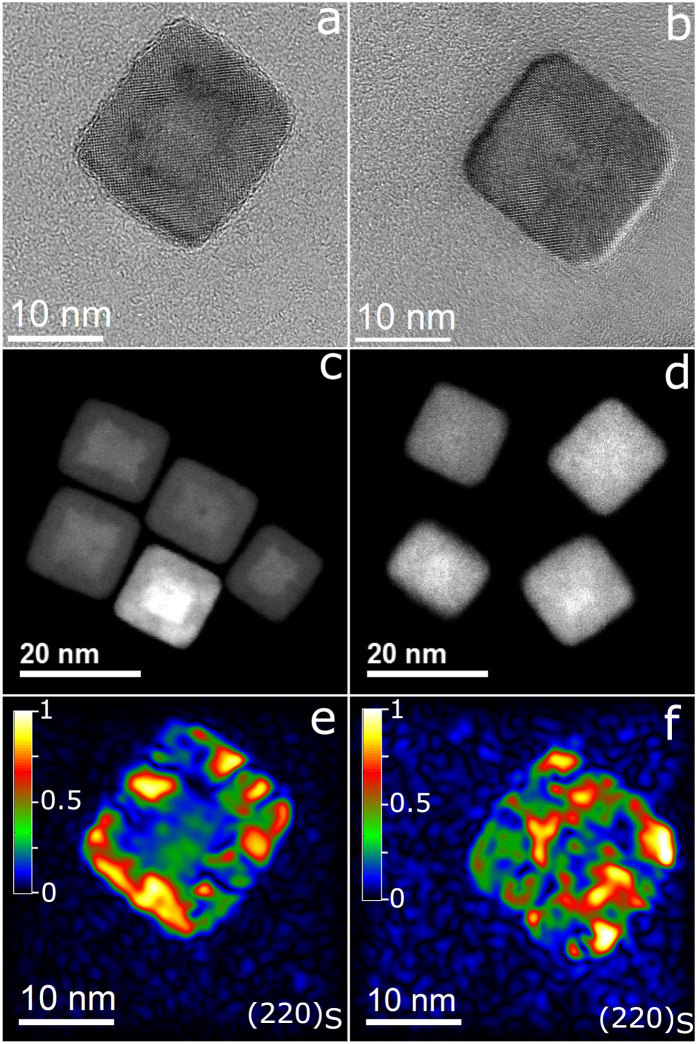
Figure 2. High resolution electron microscopy characterization.
(a,b) HRTEM, (c,d) STEM micrographs of initial core-shell nanocubes and 25 MH cycles treated nanocubes, and (e,f) amplitude maps of relative intensity of {220}S spinel-only fringe of initial core-shell and 25 MH cycles treated nanocubes, respectively, obtained from the GPA analysis. The {220}S corresponds to the Fe3O4 phase. The [001] zone-axis lies parallel to the electron beam.

