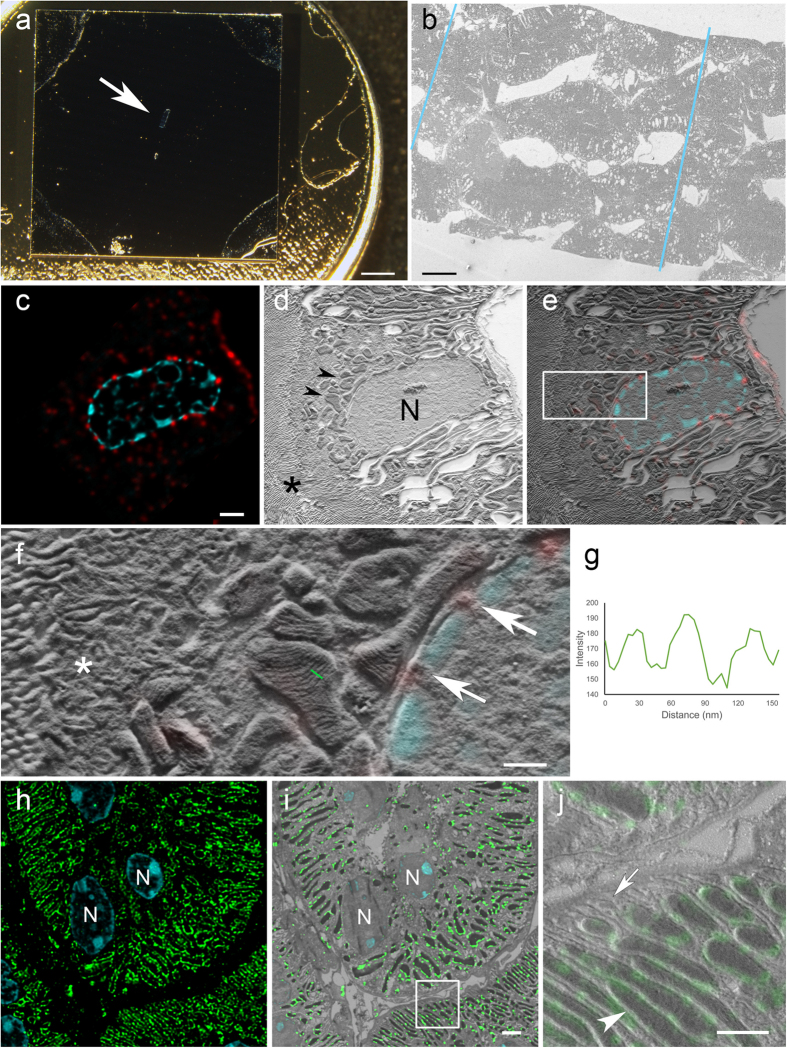
Figure 2. CLEM on silicon wafers.
(a) Tokuyasu section collected on a silicon wafer and mounted on a SEM stub. Arrow points to the section in the middle of the wafer. (b) Serial kidney Tokuyasu sections imaged at low magnification in an SEM. The borders of the sections on the image are highlighted with blue lines. (c) De-convolved confocal laser scanning microscopy image of a kidney Tokuyasu section stained with anti-nuclear pore complex protein (red), and DAPI for nuclei (cyan). The ultrathin section (100 nm) shows the distribution of the nuclear pores along the nuclear membrane. (d) SEM image of the same area. The topographical information from the tissue reveals the structure of mitochondria (arrowheads), nuclei (N) and microvilli (asterisk). (e) Overlay of (c–d) (f) High magnification image of white box in e. Asterisk labels a vesicular area, arrows point to nuclear pores identified by the correlation and in the middle of the image a group of mitochondria can be observed. Mitochondrial cristae are resolved. Images d and f acquired with Inlens SE detector. Specimen shadowed unidirectionally with 2 nm Pt/C at 8° (g) Line plot (with inverted grey values) along the cristae in f (green line) shows the topography of the cristae with an inter cristae distance of around 30 nm. (h) Overview of a confocal laser scanning microscopy image showing the expression of Tom20 (green) on mitochondrial outer membranes. The thin sections reveal “sharp”, round or elongated shapes that corresponds to the morphology of the corresponding mitochondria. DAPI staining (cyan) was used for the alignment of the images. Nuclei (N). (j) White box in (i), the tissue landscape clearly shows the differentiation of mitochondria (arrowhead) and basolateral infoldings (arrow). Image i acquired with InLens SE detector, image j with SE2 detector. Specimen rotary shadowed with 2 nm Pt/C at 8°. Scales: (a) 2 mm; (b) 20 μm; (c) 2 μm; (f) 0.5 μm; (i) 2 μm; (j) 1 μm.

