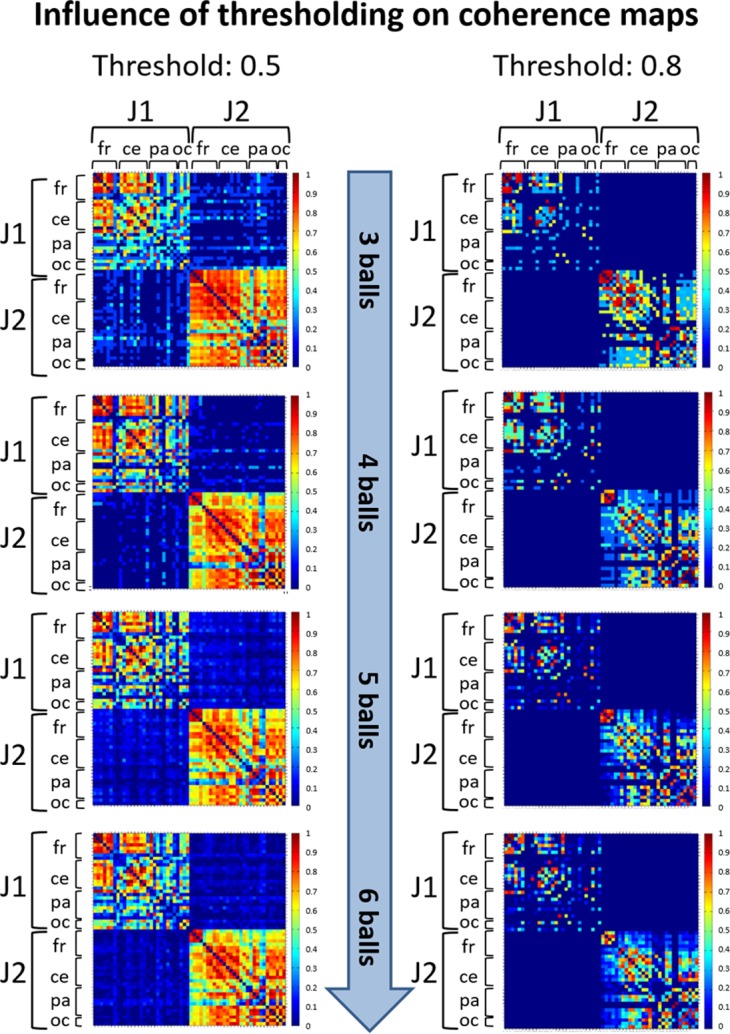
Figure 3. Illustration of coherence maps obtained using two different thresholds at values 0.5 and 0.8 in the alpha band.

In these maps the same threshold was used for within-brain and between-brain coherence values. The maps are normalized after thresholding to enhance the differences across the retained functional connections. It can be seen that variation of the threshold value does not change the general direction of observed coherence patterns.
