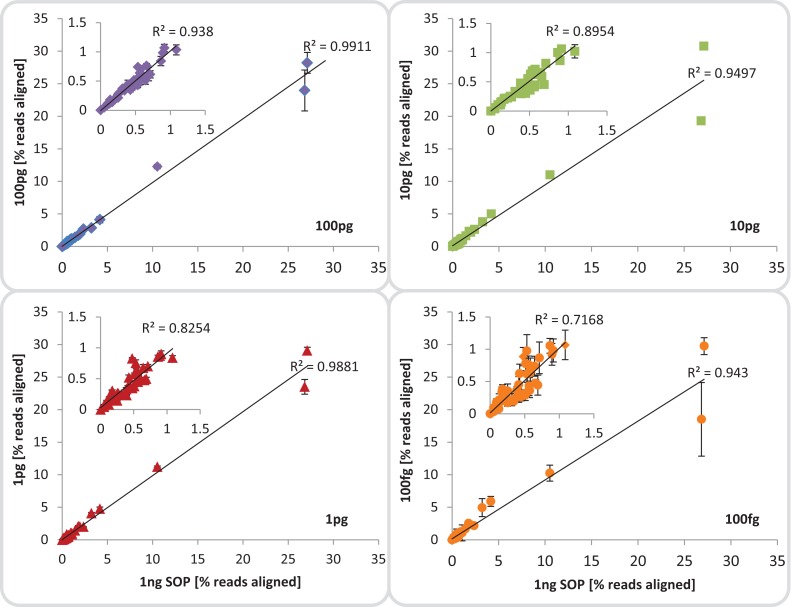
Figure 3. Mock community profile comparisons.
Correlation between the 1 ng SOP libraries (x-axes) and the low input DNA libraries (100, 10 and 1 pg, 100 fg; y-axes). Shown is the mean relative abundance of the 54 mock community members, based on reads aligned to the respective reference genomes.Inserts: show a subset of the relative abundances excluding the five most dominant organisms of the mock community. The mean standard deviation for each library is provided as error bars. The 100 fg libraries include four replicates (1, 2, 4, 5) out of five, omitting replicate 3 which was highly contaminated.

