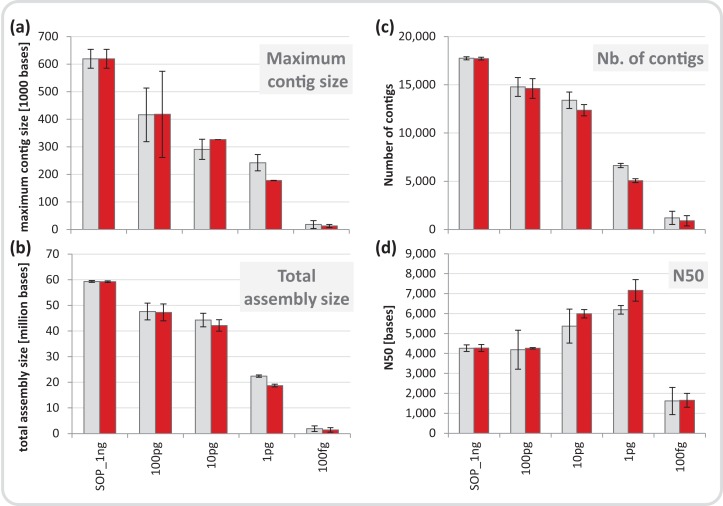
Figure 4. Mock community assembly statistics.
(A) Maximum contig size, (B) total assembly size, (C) number of contigs, and (D) N50 of the SOP and low input mock community libraries. Read files were subsample to five million read pairs. Gray bars show assemblies of all reads, red bars show assemblies after read duplicates were removed. Only contigs ≥ 1 kb were included in the analysis. All values are given as mean and standard deviation.

