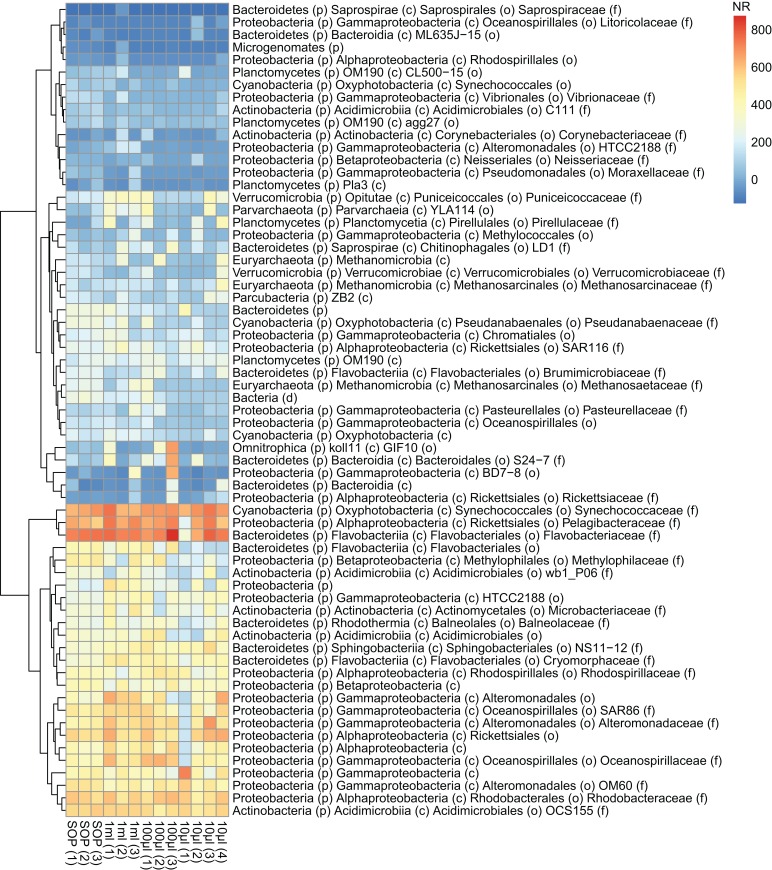
Figure 6. Abundance profiles of the marine microbial samples.
Bacterial taxonomy was assigned based on 16S rRNA gene sequence detection of shotgun sequencing reads (graftM; see Methods). The normalized abundance is shown after square root transformation for all OTUs above the abundance threshold, resulting in a normalized read count (NR) from 0 to 800. The taxonomic assignment is provided down to the family level if available, otherwise the best available taxonomic rank is given.

