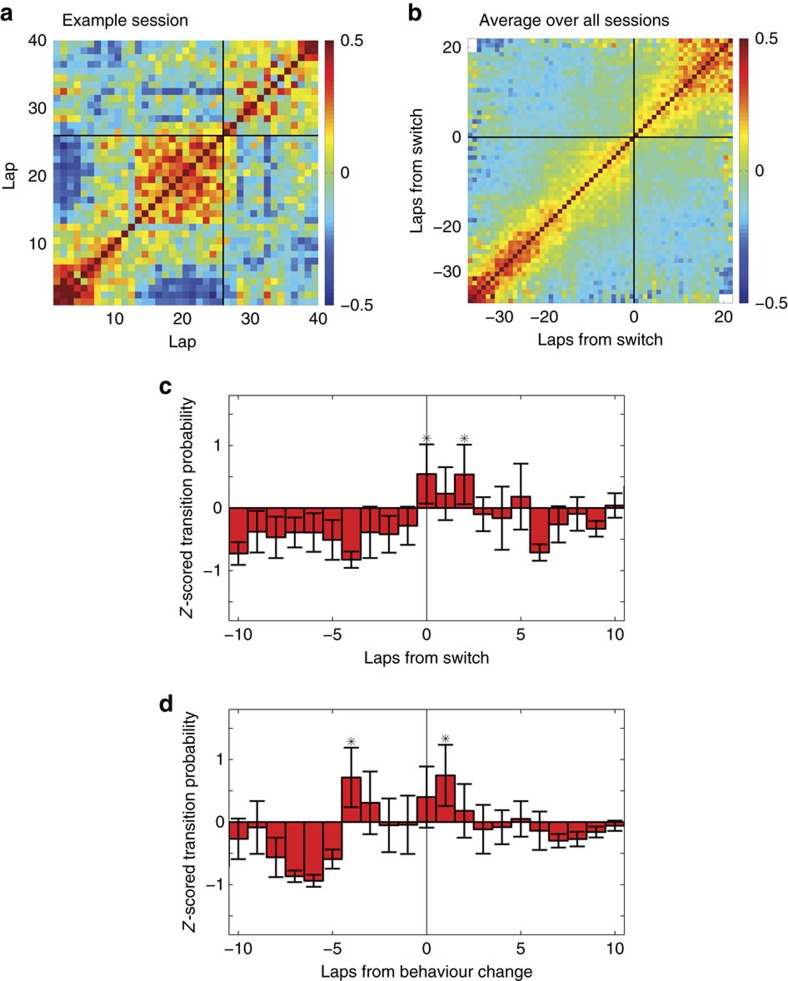
Figure 3. mPFC population firing changes follow task criterion changes but precede behavioural changes on the MT-LRA task.
(a) Lap–lap correlation of the population firing vectors for one session, with the switch lap marked (black line). (b) Average lap–lap correlation of the population firing vectors over all sessions aligned to the switch lap for each session. (c) Averaged Z-scored transition scores between matched-choice laps over all MT sessions aligned to the switch lap for each session (error bars show s.e.m., n=12). Normalization is bootstrap against interspike interval shuffles. (d) Averaged Z-scored transition scores aligned to the detected behavioural change (error bars show s.e.m., n=12). Asterisks indicate values significantly larger than zero (α=0.05) as indicated by a Z-test. Alternate normalizations are shown in Supplementary Fig. 4.

