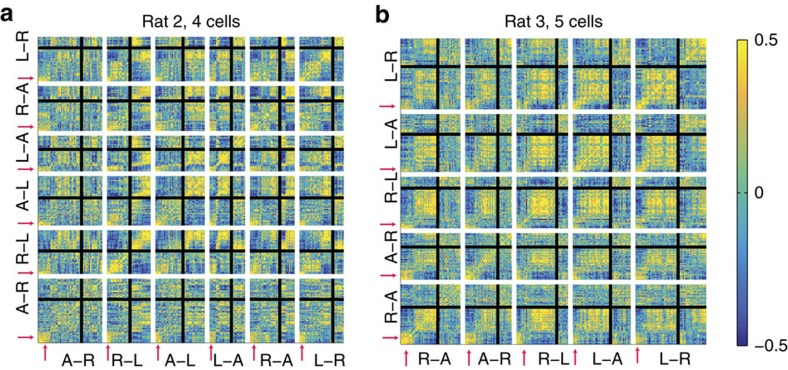
Figure 7. Correlation plots for the spatial population firing vector patterns for cells recorded across several days for two rats on the MT-LRA task.
Four cells were recorded across 6 days for rat 2 and five cells were recorded across 5 days for rat 3. White lines separate the individual sessions, and black lines indicate the switch in each session. Note the areas of heightened self-correlation at the beginning of each session that are correlated across sessions.

