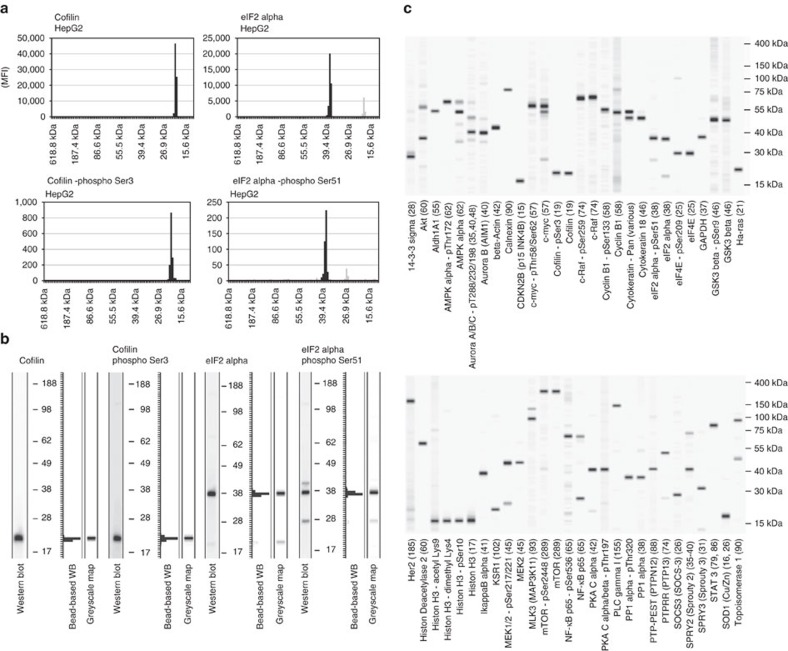
Figure 2. Comparison with western blot.
(a) DigiWest: data obtained from 4 antibodies incubated with an aliquot of a bead pool loaded with HepG2 lysate. The 96 molecular weight fractions are represented as graphs. The specific signal is coloured dark grey. (b) The same antibodies used against the HepG2 lysate. Classical western blot (left), DigiWest data, illustrated as a graph (middle, same data as in a), and greyscale maps generated from DigiWest data (right, same data as in a). (c) Greyscale maps generated from 56 antibody incubations on the HepG2-lysate-loaded bead pool. A more comprehensive comparison of >100 antibodies on the western blot and DigiWest is provided in Supplementary Fig. 1.

