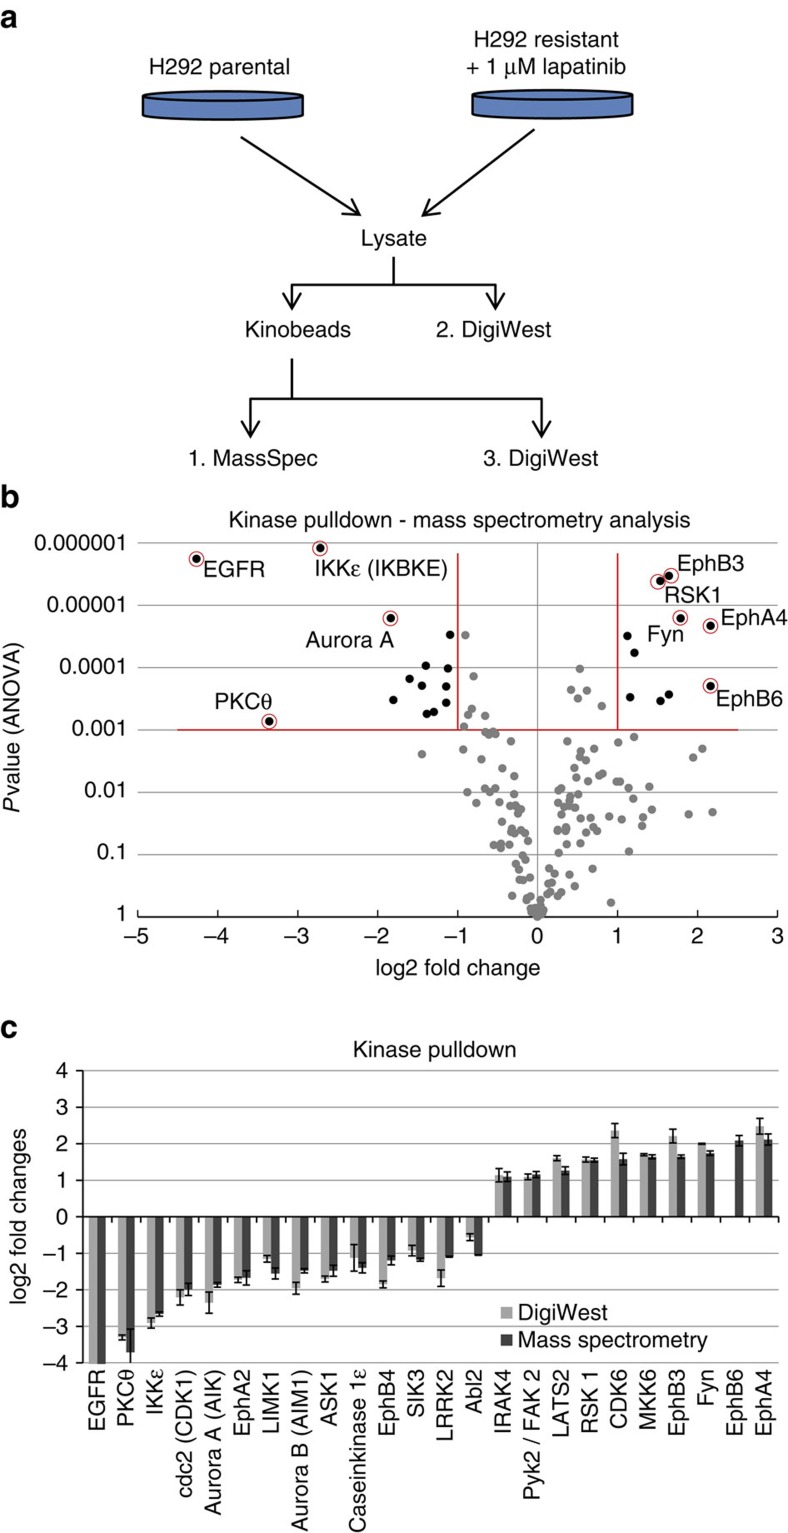
Figure 4. Lapatinib resistance in the H292 lung cancer cell line.
(a) Experimental setup. Parental and Lapatinib-resistant H292 cell lines were lysed, and a portion was used for Kinobead pull-down and mass spectrometry analysis, followed by analysis using DigiWest. Whole-cell lysates were analysed using DigiWest. (b) Volcano plot of the mass spectrometry analysis (in triplicate), log2 fold change of the Lapatinib-resistant H292 cell line compared with the parental cell line. (c) A set of 24 kinases displayed significant changes (ANOVA P<0.001, fold change>2, peptides≥2). This set of kinases was re-analysed using DigiWest. The Pearson's correlation coefficient for these two methods was 0.98 (EGFR excluded). EphB6 could not be measured because no suitable antibody was available.

