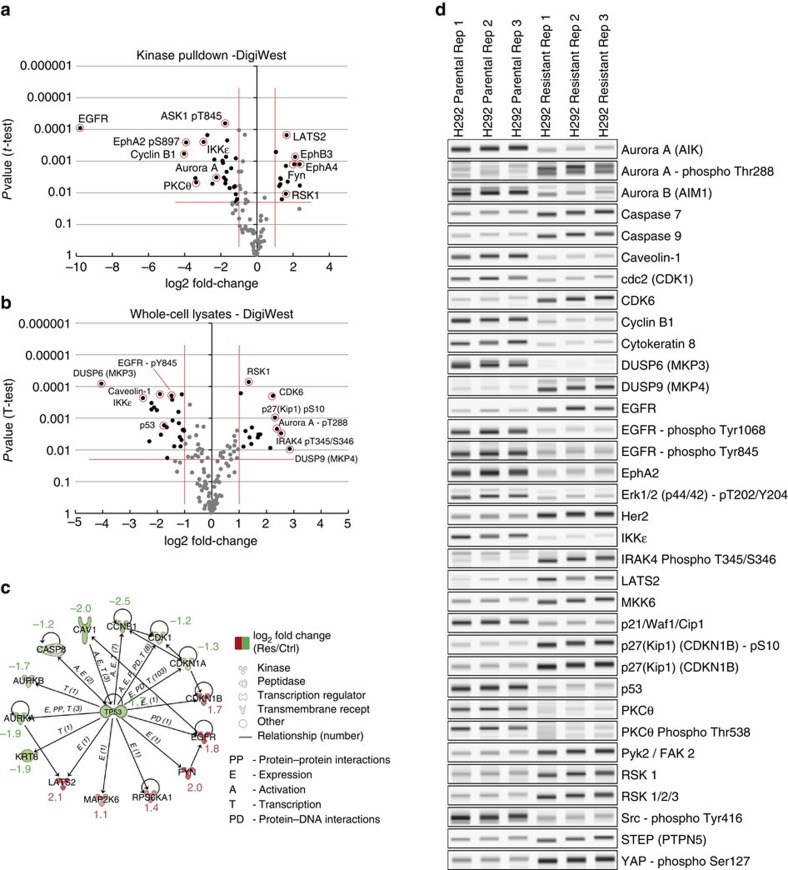
Figure 5. DigiWest results.
(a) Volcano plot of the Kinobead pull-down analysis. The data contained in this volcano plot are based on quantified signals obtained from an equivalent to about 1,000 western blot lanes. Samples were performed in triplicate. A total of 185 analytes were detected, including 74 phosphorylations. Log2 fold change of the Lapatinib-resistant H292 cell line compared with the parental cell line. P values are from t-tests with Welch approximations. (b) The same analysis as in a, but for whole-cell lysates. (c) Detail of the Ingenuity pathway analysis indicating p53 as the central regulator. (d) Whole-cell lysate analysis. Digital reconstruction of western blots (greyscale maps) from the DigiWest data representing the 34 most significantly changed analytes in alphabetical order.

