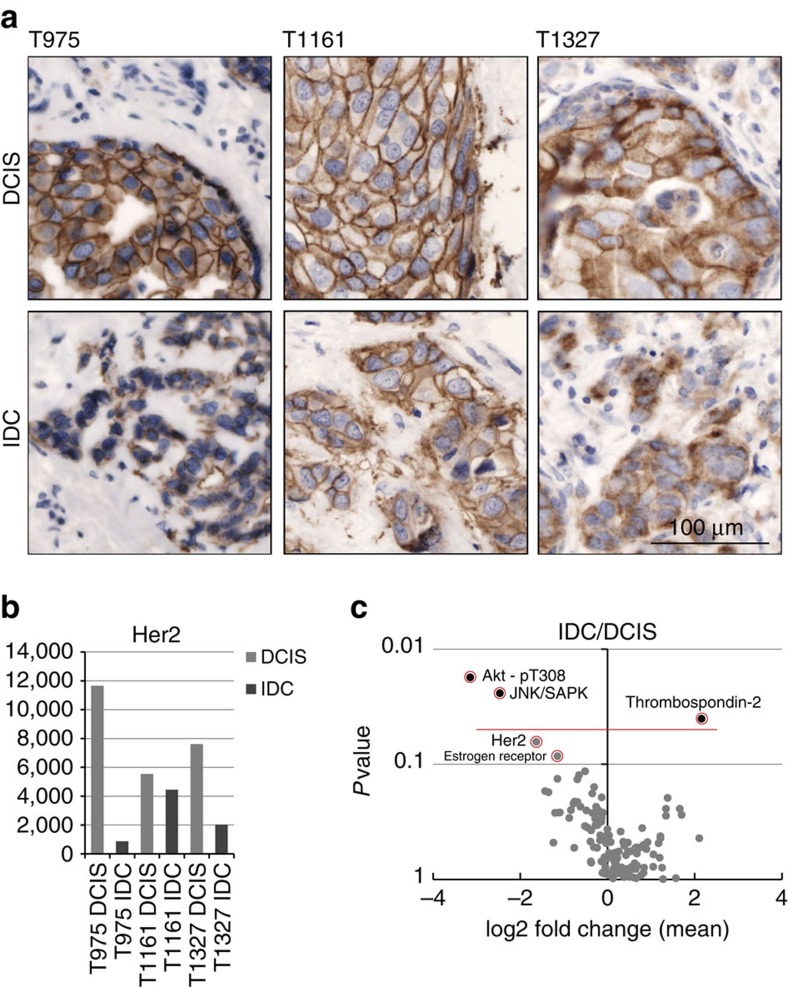
Figure 6. DigiWest from LCM-derived primary tumour cells.
Paired IDC and DCIS LCM samples were analysed using DigiWest.(a) Her2-stained sections, paired IDC and DCIS from three patients. (b) Her2 signals for the LCM samples on DigiWest. (c) Volcano plot representing the mean IDC/DCIS ratio for all measured analytes versus significance. P values were derived from t-tests with Welch approximation. The data contained in this volcano plot are based on quantified signals obtained from an equivalent to about 1,000 western blot lanes.

