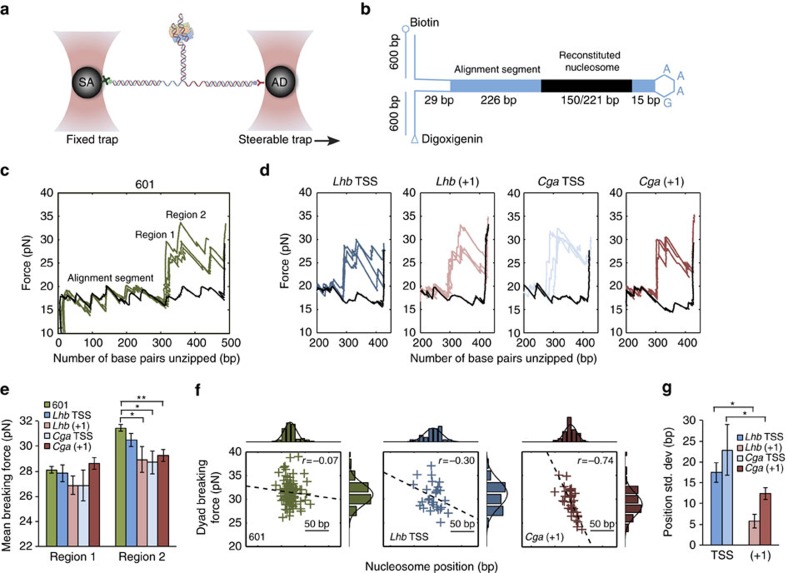
Figure 2. Single-molecule probing of nucleosomes reconstituted on Cga and Lhb DNA sequences.
(a) Nucleosomes reconstituted on Lhb and Cga DNA sequences (150 bp), and a DNA sequence harbouring the 601 DNA-positioning element (221 bp) are connected to dsDNA molecular handles, which are attached to polystyrene beads trapped in two separate optical traps. One of the traps is moved to stretch the tethered construct. (b) The reconstituted nucleosome is ligated to a fixed alignment sequence and a short stem-loop that prevents breaking of the tether after unzipping. (c) Unzipping curves for nucleosomes reconstituted using the 601 sequence (green) and the ‘naked' (that is, no nucleosome) 601 sequence (black). (d) Unzipping curves of nucleosomes reconstituted on the TSS and +1 sequences of Lhb and Cga, and their respective naked DNA curve. (e) Breaking force for region 1 and region 2 interactions, for all probed nucleosomes. Data shown as mean±s.e.m., n=88, 28, 8, 7 and 37; P=0.002, 0.03 and 0.02, two-sample Kolmogorov–Smirnov test. *P<0.05, **P<0.01. (f) Two-dimensional scatter plots of region 2 breaking force versus position, with univariate histograms of the force (top) and position (right). Data shown include all the individual measured unzipping traces for 601, Lhb TSS and Cga +1 nucleosomes. Gaussian fits to the histograms (solid black) and linear fits to the scatter plot data (dashed black) are drawn to guide the eye. (g) Positional dispersion of the Lhb and Cga nucleosomes. Data shown as region 2 position s.d.±s.e., n=28, 8, 7 and 37; P=0.02 and 0.02, Ansari–Bradley test. *P<0.05.

