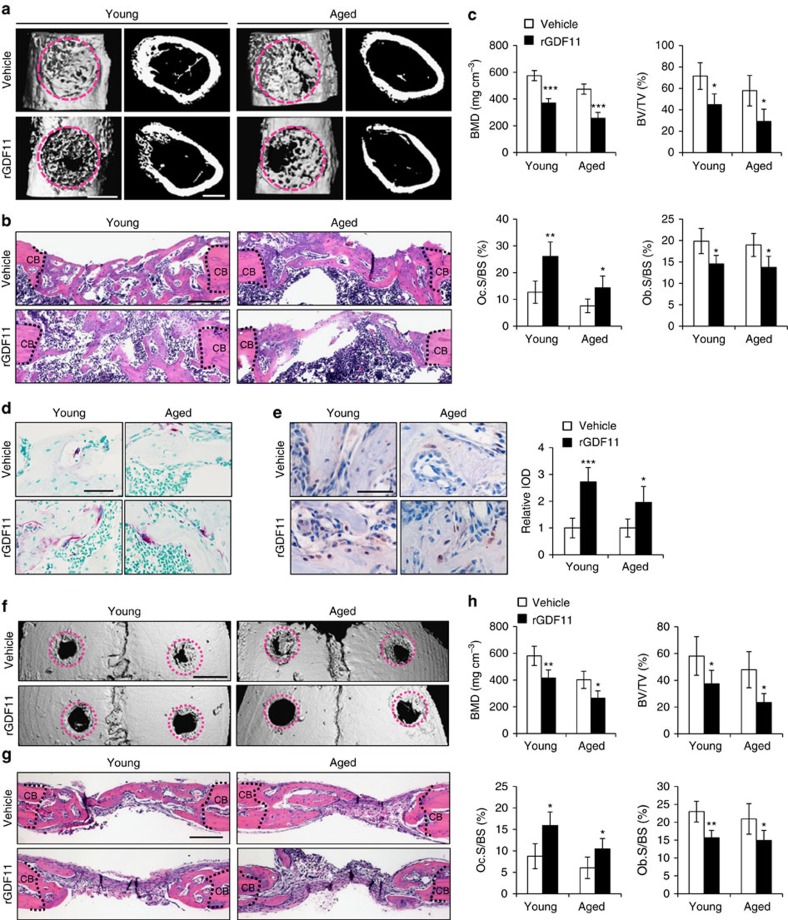
Figure 6. GDF11 impairs regeneration of bone defects.
(a) Representative images of microCT reconstruction of femoral cortical bone defects. The red dotted lines indicate the position of the original defect margin. Scale bar, 500 μm. (b) H&E staining of femoral cortical bone defects. The black dotted lines indicate the position of the original defect margin. Abbreviation: CB, cortical bone. Scale bar, 200 μm. (c) Bone mineral density (BMD) and histomorphometric analysis of the regenerated bone in femoral cortical gaps. Results are shown as mean±s.d. The mean values of the bilateral defects of each mouse were counted as individual data points (n=5). *P<0.05, **P<0.01 and ***P<0.001 by t test. (d) Representative images of TRAP staining of the regenerated bone in femoral cortical gaps. Scale bar, 50 μm. (e) Representative images and quantification of immunohistochemical staining of pSmad2/3. rGDF11 injections increased the phosphorylation of Smad2/3. Scale bar, 50 μm. (f) MicroCT reconstruction of the calvarial defects. The red dotted lines indicate the position of the original defect margin. Scale bar, 1 mm. (g) H&E staining of the calvarial defects. The dotted lines indicate the position of the original defect margin. CB, cortical bone. Scale bar, 200 μm. (h) Bone mineral density (BMD) and histomorphometric analysis of the regenerated bone in calvarial defects. Results are shown as mean±s.d. The mean values of the bilateral defects of each mouse were counted as individual data points (n=5). *P<0.05 and **P<0.01 by t test.

