
Figure 2.
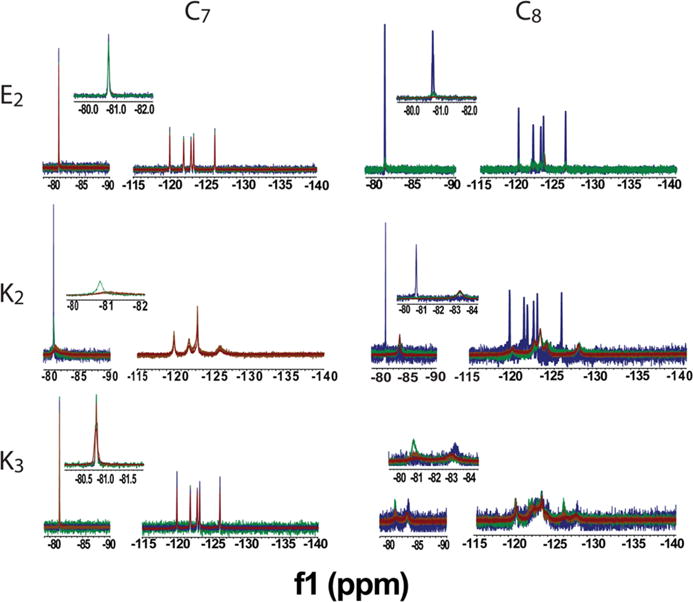
Comparison of NMR spectra for each F-PA as a function of peptide concentration: 1.0 mM (blue), 1.5 mM (green), 2.0 mM (orange) and 3.0 mM (red). C7E2 and C7K3 maintain sharp peaks at the higher concentrations needed to obtain 19F MR images. The other conjugates exhibited sharp spectral features only at concentrations lower than 2 mM or always exhibited broad features. Measurements conducted at pH 6.5.