
Figure 3.
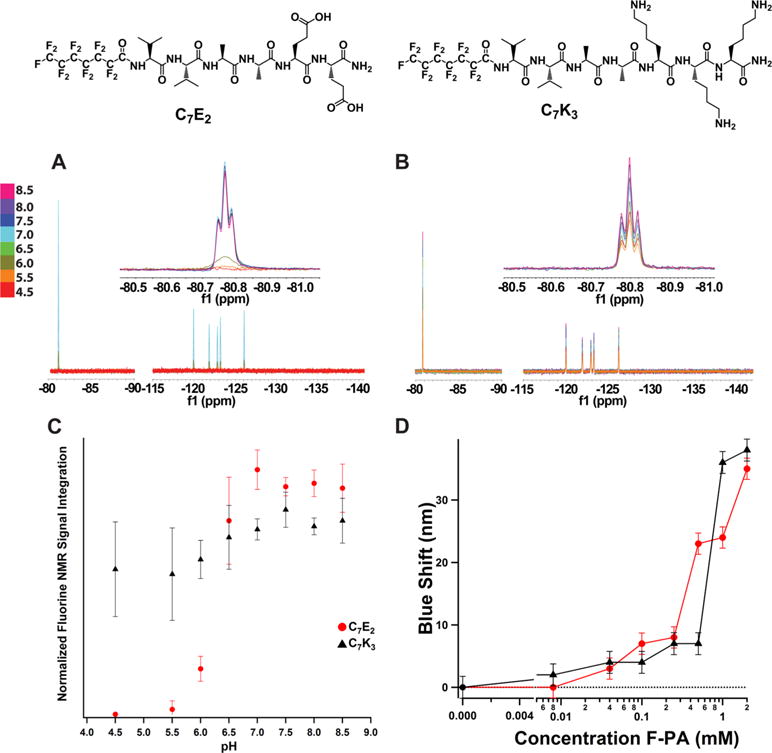
19F NMR pH response of (A) C7E2 and (B) C7K3. Both C7E2 and C7K3 line shapes were found to be robust to pH changes during titration. (C) C7K3 and C7E2 both showed an increase in NMR signal in response to pH starting around 5.5. C7E2 signal reached maximum at pH 6.5, whereas C7K3 signal increased slowly through the pH values tested. (D) Nile red fluorescence assay of C7E2 and C7K3. Concentration of F-PA is plotted versus blue shift of the Nile red florescence peak (measured at 658 nm). Dotted line is fluorescence maximum of Nile red in water. Both compounds exhibit detectable blue shifts (and therefore critical aggregation concentrations) at or below 0.1 mM. This implies that, at the 2 mM concentration and pH 7.5, less than 5% of compound is in the monomeric state.