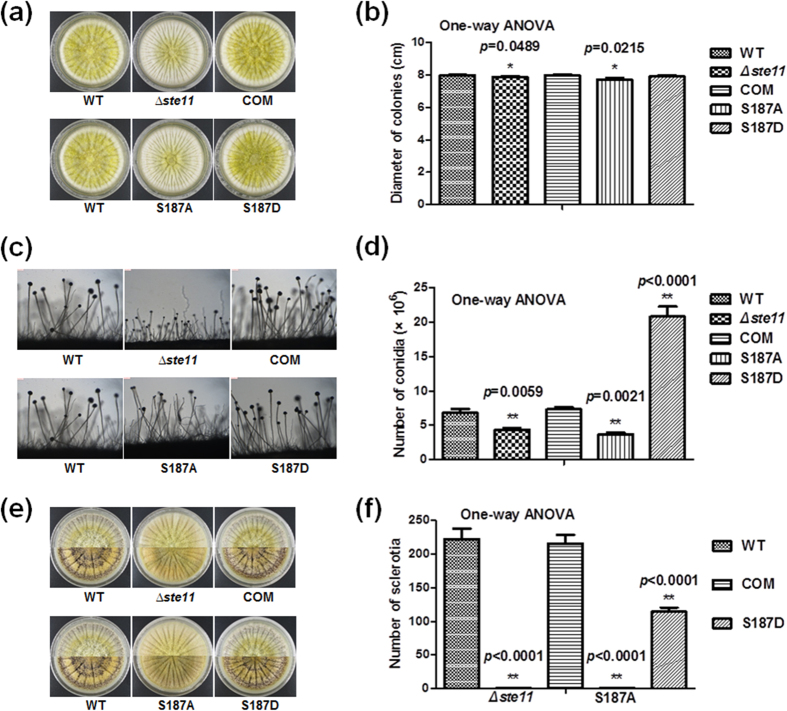
Figure 7. Phenotypic analyses of WT, ∆ste11, COM, S187A and S187D mutants.
(a) Colonial morphology. (b) Column diagram of colonial diameter. (c) Morphology of conidiophores. (d) Number of spore generation. (e) Morphology of sclerotial production. (f) Quantification of sclerotia. The asterisks *represents a significant difference level of p-value < 0.05 and asterisks **represents a significant difference level of p-value < 0.01. Error bars indicate SD from 3 independent experiments.

