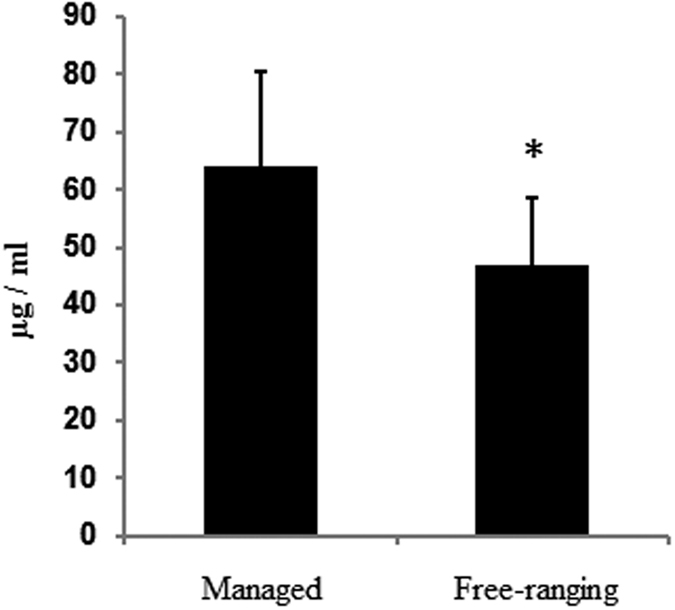
Figure 2. Vanin-1 concentration in the serum of managed or free-ranging bottlenose dolphins.

*Indicates P < 0.05 versus managed dolphins. Bars represent mean vanin-1 serum concentration. Error bars indicate standard deviation.

*Indicates P < 0.05 versus managed dolphins. Bars represent mean vanin-1 serum concentration. Error bars indicate standard deviation.