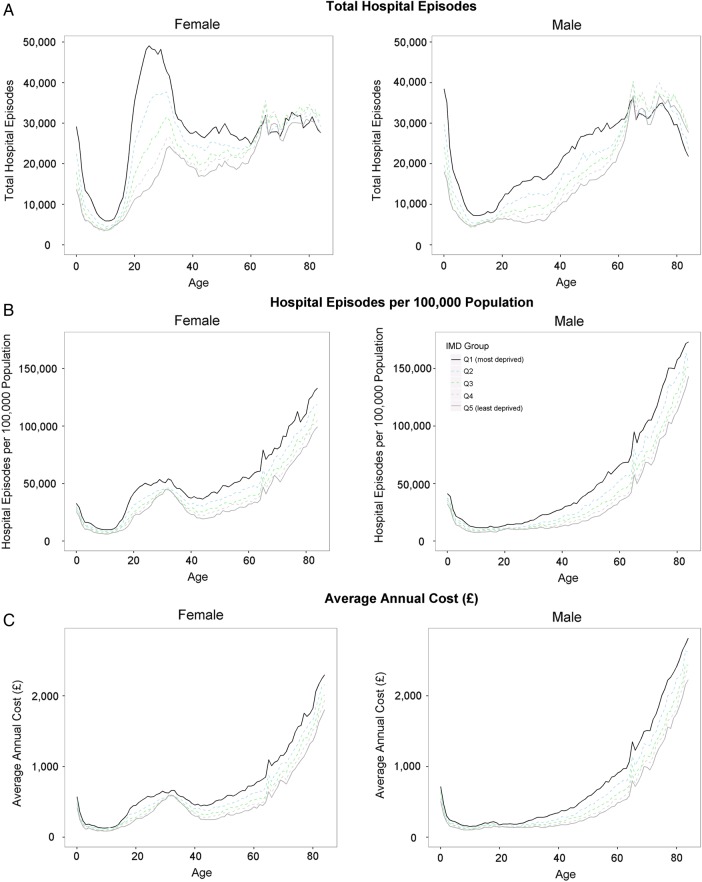
Figure 1.
All hospital inpatient admissions split by age, sex and deprivation. Graphs are based on hospital episode statistics for year 2011/2012 and are broken down by sex (female on the left male on the right), deprivation (different line colours) and are plotted against age. (A) Shows the total number of hospital episodes. (B) Shows the hospitalisation rate that is, adjusts for the demographic structure of the population. (C) Translates from hospital episodes to average annual costs due to these hospitalisations.

