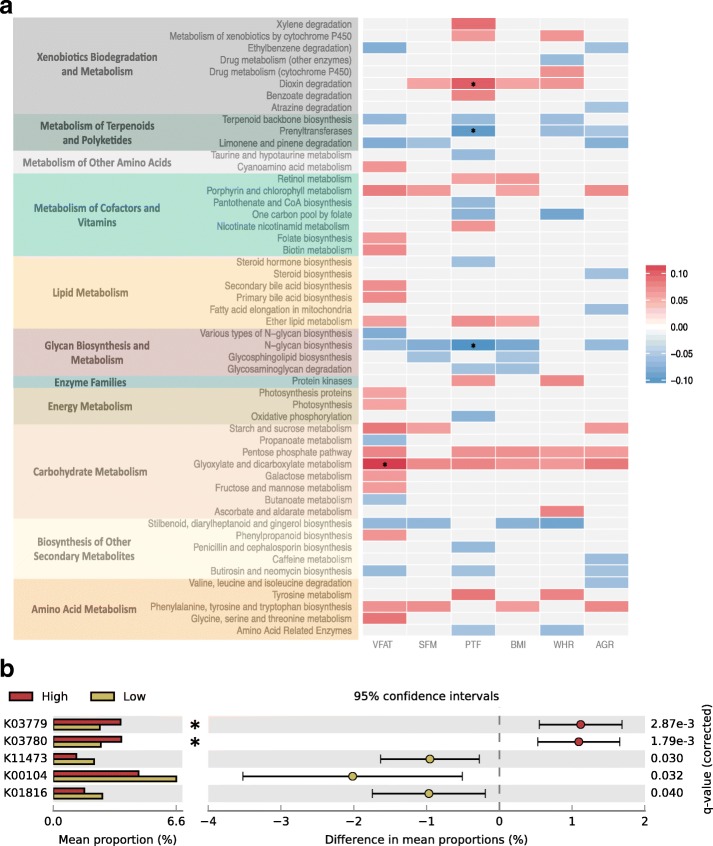
Fig. 4.
Microbial functional analysis in obesity. a Microbial PICRUSt-predicted KEGG functions relevant to metabolism in the twin dataset, and their association with the six adiposity measures. The heatmap denotes the direction of association between each microbial PICRUSt-predicted KEGG function and adiposity measures, where blue indicates a negative association, while red indicates a positive association. Bonferroni-significant associations are highlighted (*). b Five KO genes that are differentially abundant between high and low visceral fat individuals in glyoxylate and dicarboxylate metabolism, as tested by a two-sided Welch’s t test. FDR-adjusted P values are reported at the right of the image, and stars indicate Bonferroni-significant associations. Figure was produced using STAMP [45]

