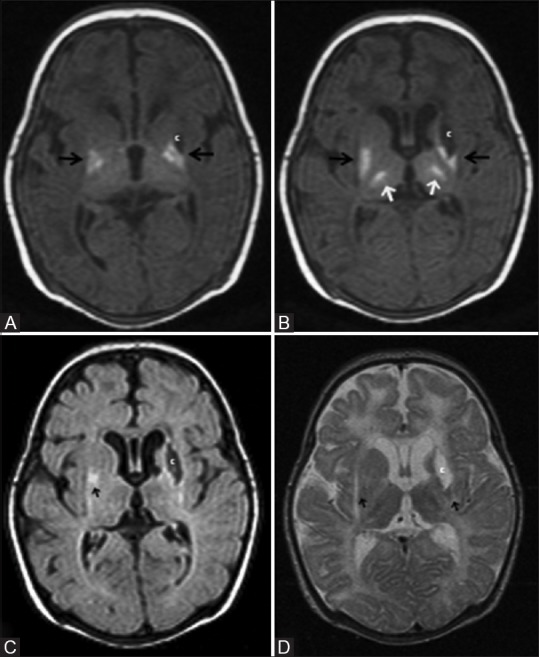
Figure 11 (A-D).

A 29-day-old term neonate, with severe hypoxic ischemic encephalopathy (stage III) at birth, shows basal ganglia thalamic pattern of injury. (A, B) Axial T1WI at the level of lateral and third ventricles show hyperintensity at the bilateral ventrolateral thalami and posterior putamina, and T1 hypointensity (cyst) at left globus pallidus. Also note the nonvisualization of myelination (T1 hyperintensity) at the posterior limb of internal capsule. Axial FLAIR (C) and (D) T2WI at the level of lateral ventricles show cerebrospinal fluid (CSF) intensity cyst (T2 hyperintensity and suppression of signals on FLAIR) with peripheral gliosis at the left globus pallidus. Note the subtle T2 hyperintensity at the bilateral posterior putamina and ventrolateral thalami and the minimal cystic changes at the bilateral frontal periventricular white matter
