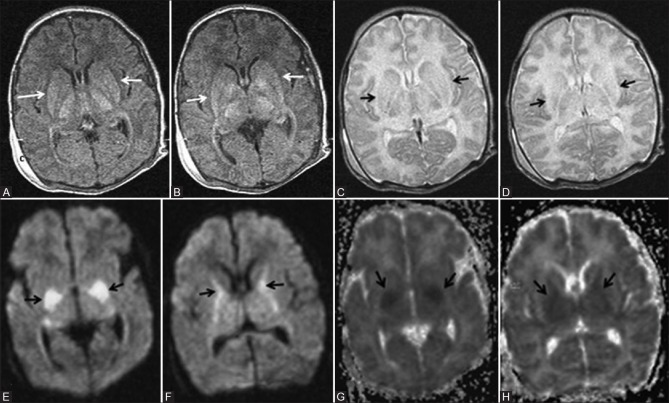
Figure 12 (A-H).
A 12-day-old full-term neonate; HIE stage II—severe hypoxic ischemic injury involving deep grey matter structures. (A, B) Axial T1WI at the level of basal ganglia shows abnormal T1 hyperintensity of the ventrolateral thalamus and posterior putamen (black arrows). Note the absence of normal T1 hyperintensity of the posterior limb of internal capsule. (C, D) Axial T2WI at the level of basal ganglia shows abnormal T2 hyperintensity of the thalamus and putamen (black arrows). Note the absence of normal T2 hypointense signal of the posterior limb of internal capsule. (E, F) Axial DWI at the level of basal ganglia shows diffusion restriction involving the posterior putamina and internal capsules (black arrows). (G, H) Axial ADC maps at the level of basal ganglia show corresponding hypointensity in the posterior putamen and internal capsules, denoting diffusion restriction (black arrows)

