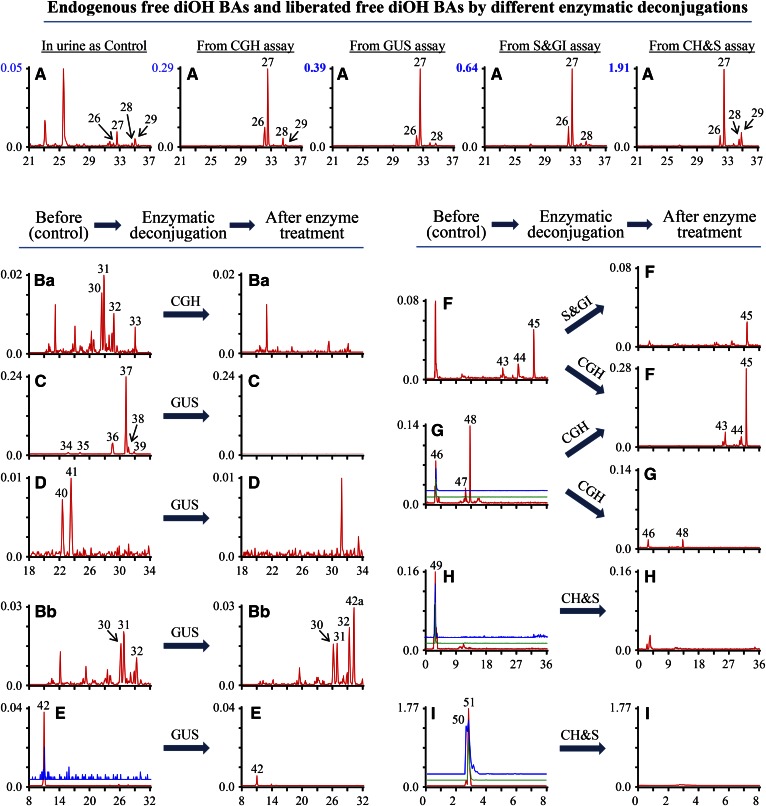
Fig. 5.
Comparison of selected ion monitoring chromatograms of diOH BAs and MRM scan chromatograms of their conjugates in urine of breast-fed female piglets before and after enzymatic deconjugation. Y-axis on the graph represents the peak-height ratio of endogenous BAs to the IS and the X axis the Rt. in minutes. A: Chromatogram for free diOH BAs was generated by a selected ion m/z 391.4. MRM scan chromatograms generated by MRM ion pairs: m/z 448.6/74.0 for G-diOH BAs (Ba) and (Bb); m/z 567.7/391.4 for diOH BA-GlcUA (C); m/z 594.8/391.4 for diOH BA-GlcNAc (D); m/z 624.7/97.0 (red line), 624.7/391.4 (blue line) for G-diOH BA-GlcUA (E); m/z 471.6/97.0 for diOH BA-GlcNAc (F); m/z 288.9[M-2H]2−/97.0 (red line), 578.8/97.0 (blue line) and 578.8/124.0 (green line) for T-diOH BA-S (G); m/z 286.9[M-2H]2−/97.0 (red line), 574.7/97.0 (blue line) and 574.7/124.0 (green line) for T-monoOH BA-Δ4−3-one-S (H); m/z 390.4[M-2H]2−/97.0 (red line), 781.9/97.0 (blue line) and 781.9/124.0 (green line) for T-diOH BA-S-GlcNAc (I).

