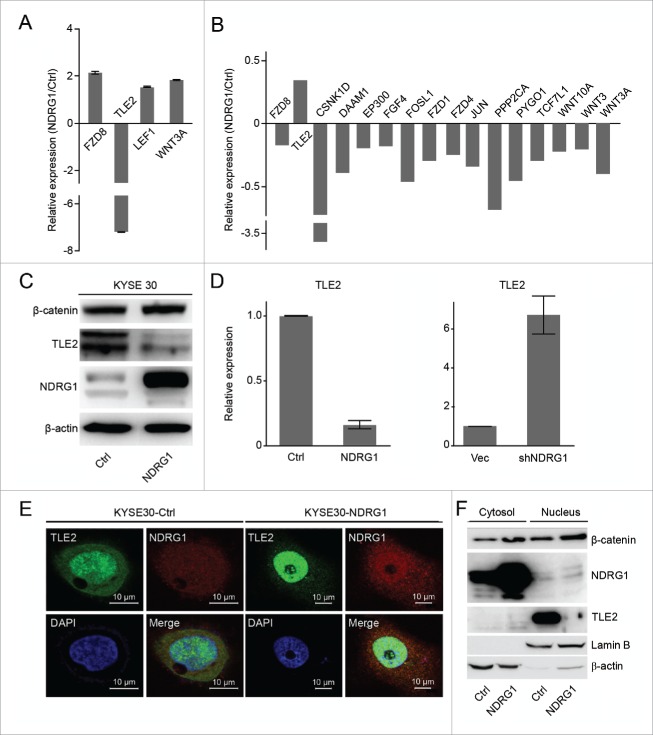
Figure 3.
NDRG1 impacts the Wnt pathway via TLE2 and β-catenin in esophageal cancer cells. (A) Relative gene expression levels of FZD8, TLE2, LEF, and WNT3A were analyzed in KYSE 30 cells overexpressed NDRG1 (KYSE 30-NDRG1) compared with those in mock cells (KYSE 30-Ctrl) using real-time PCR arrays. (B) mRNA levels of Wnt pathway-associated genes in NDRG1 knock-down cells (KYSE 30-shNDRG1, shNDRG1) were assessed by quantitative RT-PCR and compared with mock cells (KYSE 30-vec, vec). (C) Protein levels of NDRG1, TLE2 and β-catenin from KYSE 30-NDRG1 and KYSE 30-Ctrl cells were measured by Western blot. (D) Quantitative RT-PCR results validated the mRNA levels of the TLE2 in KYSE 30-NDRG1 and NDRG1 knock-down (KYSE 30-shNDRG1) cells. (E) The colocalization of NDRG1 and TLE2 was analyzed by confocal microscopy in KYSE 30-NDRG1 and KYSE 30-Ctrl cells. TLE2 was mainly localized in the nuclei, while NDRG1 was expressed in both the nuclei and cytoplasma. NDRG1 and TLE2 colocalized in the nuclei.Green fluorescence, TLE2; red fluorescence, NDRG1; blue fluorescence, nuclei stained with DAPI. Scale bar, 10 μm. (F) Cytosolic and nuclear proteins were isolated from KYSE 30-NDRG1 and KYSE 30-Ctrl cells, and NDRG1, β-catenin and TLE2 expression was analyzed by western blot. Lamin B, nuclear marker; β-actin, cytoplasmic marker.

