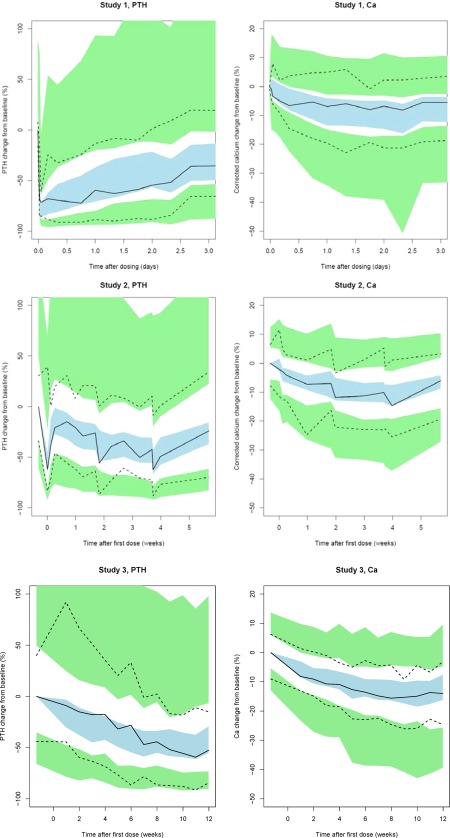
Figure 3.

Visual predictive check based on the final population pharmacokinetic/pharmacodynamic (PK/PD) model for change from baseline in parathyroid hormone (PTH; top left) and corrected calcium (Ca; top right) after administration of a single dose of etelcalcetide in study I, and for PTH (bottom left) and corrected Ca (bottom right) after repeated administration of etelcalcetide in study III. In all panels, lines represent median (solid line), 5th and 95th percentile (dashed lines) of observed change from baseline. Shaded areas represent the 95% prediction interval of the median (blue) or 5th and 95th percentile (green) from the simulations.
