
Figure 2.
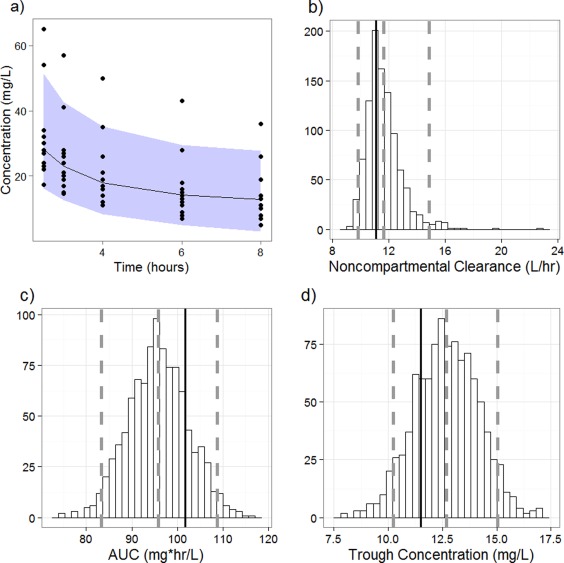
Predictive checks. (a) Visual predictive check. The black circles represent the observed vancomycin concentrations. The black line represents the median concentrations from the simulations. The gray shaded area represents the 2.5th and 97.5th percentile of the simulated data points to denote a 95% CI. The five uppermost points represent concentrations from one patient who was considered an outlier in this analysis. b–d: Clinical predictive check. The histogram represents posterior predictive distribution of noncompartmental clearance (b), AUC (c), and trough concentration (d) from the 1,000 simulated datasets. The black line represents the mean of the observed data. The gray lines represent the median and 2.5th and 97.5th percentiles of the simulated datasets.