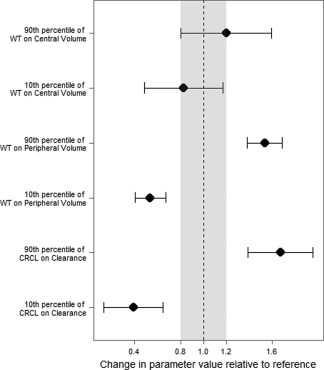
Figure 3.

Clinical relevance of covariates. This graph represents the calculation of covariate effects on relevant PK parameters. The shaded region represents a 20% difference from the typical value, a clinical equivalence range. The bars represent the 95% CI of parameter changes relative to each extreme of the covariate.
