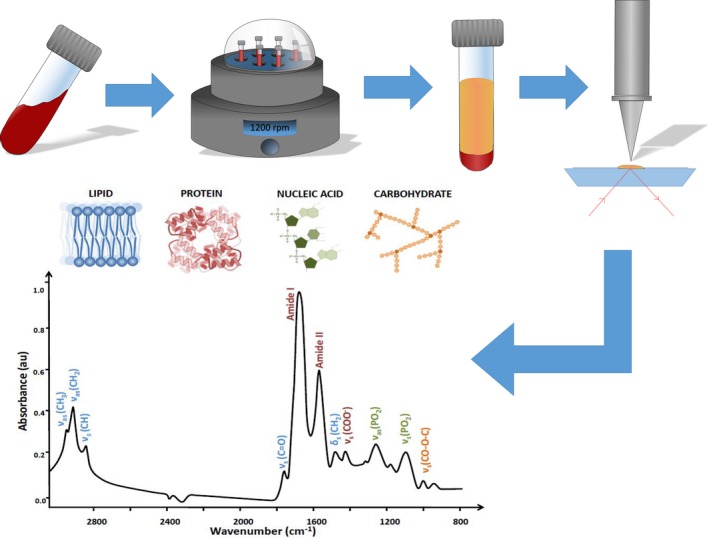
Figure 2.

The process from the blood sample being obtained up until the acquired spectrum. Starting with the blood sample taken from the patient, which is then centrifuged to separate out the serum from all other components. The serum is then analyzed using ATR‐FTIR spectroscopy, which produces a spectrum allowing the protein, lipid, nucleic acid, and carbohydrate peaks to be seen. Data analysis follows which differentiates cancerous samples from healthy samples. Figure adapted from (Baker et al. 2014).
