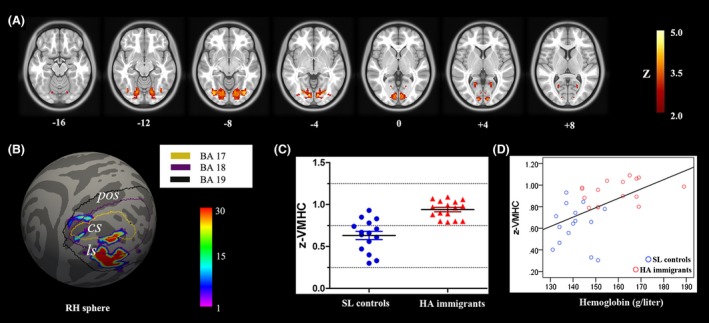
Figure 1.

Between group comparison for VMHC. (A) Seven symmetric axial slices show group differences in homotopic voxel‐mirrored connectivity (VMHC). The visual area for which the HA group exhibited significantly stronger VMHC than the control group (Z > 2.57, cluster level P < 0.05, corrected). (B) For a more accurate spatial localization, population‐based probabilistic maps of the significantly increased VMHC regions (visual cortex) were projected onto the FreeSurfer‐derived sphere surface. The outlines were labels according to Brodmann area (BA) 17, 18, and 19. (C). Scatterplots show the between‐group differences in VMHC in the bilateral visual cortex. (D) Correlation between the mean z‐VMHC index and the hemoglobin concentration in both SL controls and HA adults (P < 0.05, Bonferroni corrected). RH, right hemisphere; cs, calcarine sulcus; pos, parietooccipital sulcus; ls, lingual sulcus.
