Figure 3.

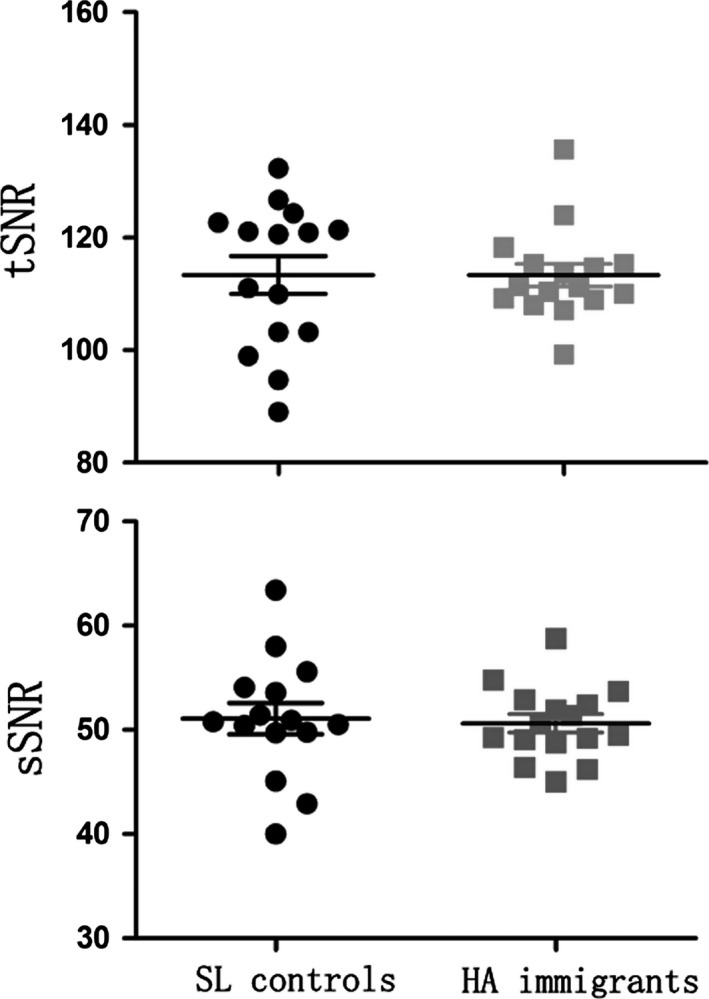
Scatterplots show the between‐group comparisons for the time‐series signal‐to‐noise ratio (tSNR) and spatial SNR (sSNR). SL, sea level; HA, high‐altitude.

Scatterplots show the between‐group comparisons for the time‐series signal‐to‐noise ratio (tSNR) and spatial SNR (sSNR). SL, sea level; HA, high‐altitude.