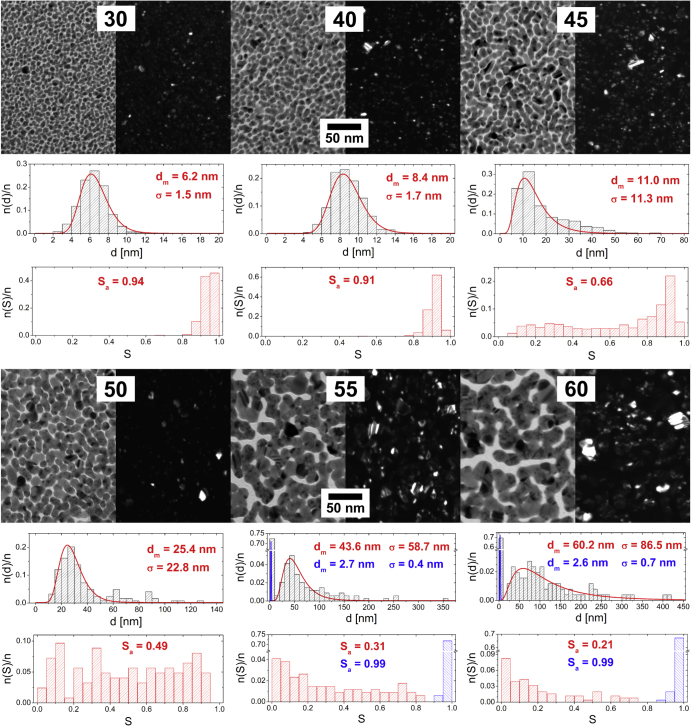
Figure 2.
TEM micrographs of Ag/a-C:H:O nanocomposite films deposited at different RF powers (W) as measured right after their deposition. In each case, a bright field image (left) is displayed together with the corresponding dark field image of the same spot (right). For each micrograph, a distribution histogram of equivalent nanoparticle diameters d with its log-normal fit and modal value of nanoparticle diameter (dm) and its standard deviation (σ) are displayed (top). The corresponding histogram of nanoparticle shape factor S and the average value of shape factor (Sa) are displayed (bottom).

