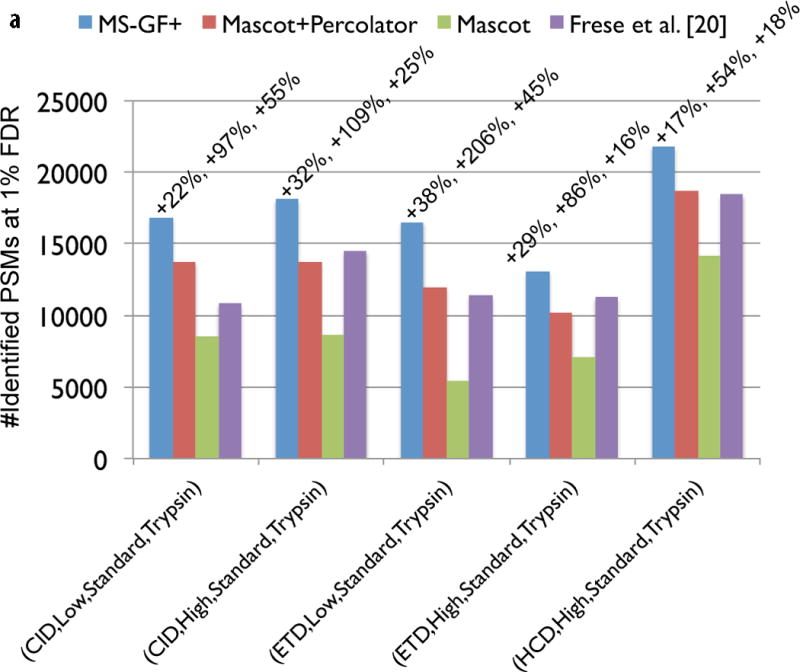
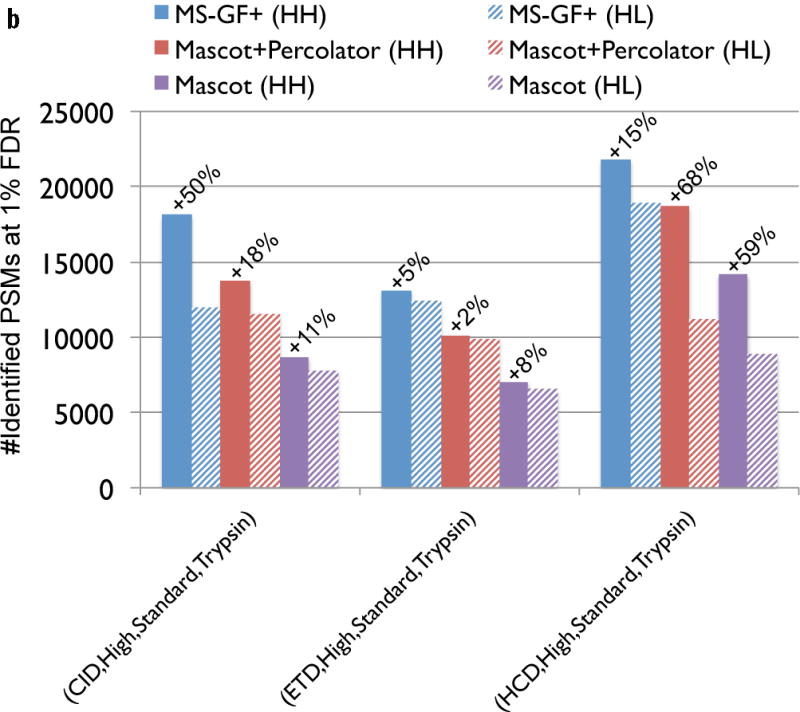
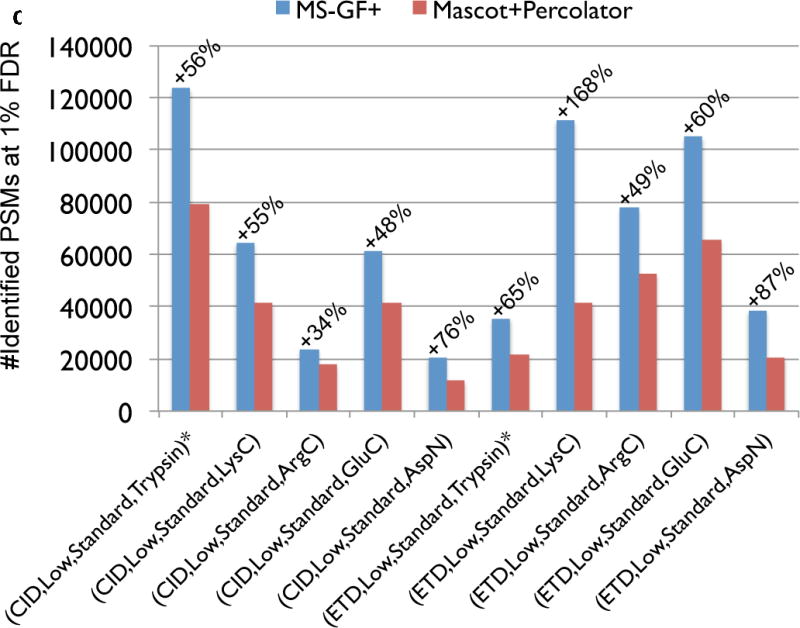
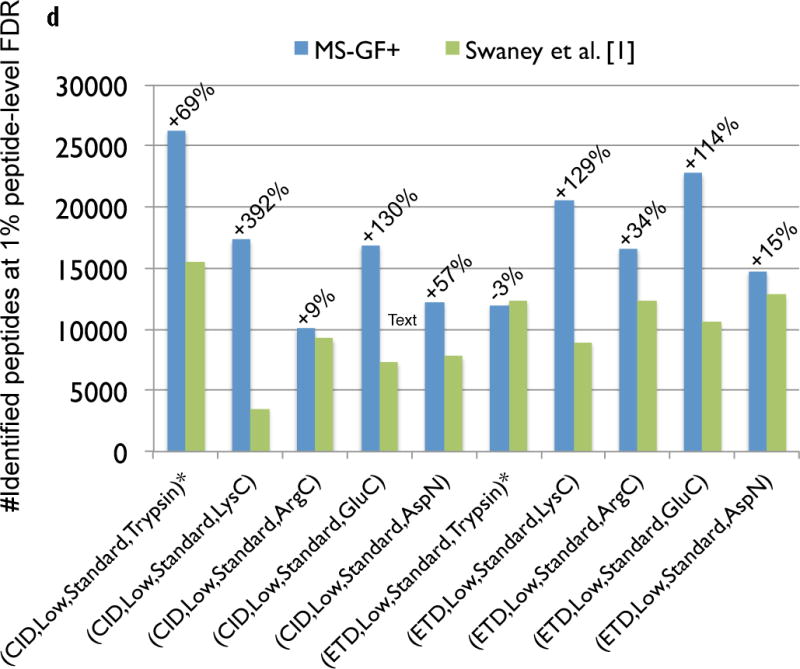
Figure 3.


Comparison of MS-GF+ and other tools for diverse spectral types. The numbers of identified PSMs (a–c) or peptides (d) at 1% FDR are shown. Numbers above bars represent the percentages of increase in the number of identifications for MS-GF+ compared to other tools. (a) Results for the human datasets with varying fragmentations and instruments. MS-GF+, Mascot+Percolator, and Mascot results are shown along with the results in [20]. Percolator greatly increased the number of identifications as compared to Mascot, but MS-GF+ outperformed Mascot+Percolator for all the datasets. (b) Increase in the number of identifications due to the availability of high-precision product ion peaks. For the three human datasets representing HH spectra, MS-GF+, Mascot+Percolator, and Mascot were run using search parameters for HL spectra. The results of these searches (denoted by HL) are compared with the numbers of identifications for the regular searches (denoted by HH). HH searches identified more PSMs than HL searches for every tool and every dataset. The difference was larger for CID and HCD than ETD spectra. (c) Results for the yeast datasets with varying fragmentations and enzymes. MS-GF+ and Mascot+Percolator results are shown. MS-GF+ outperformed Mascot+Percolator for all these datasets. (d) Comparison of MS-GF+ and the results in [1] that used OMSSA along with in-house post-processing tools for the yeast datasets. The numbers of (unique) peptides at the peptide-level 1% are shown. In [1], only the number of identified peptides matched to proteins identified at 1% protein-level FDR was counted while for MS-GF+, the number of identified peptides was counted regardless of their matched proteins.
