
. 2016 Sep 22;9:5809–5817. doi: 10.2147/OTT.S107946
© 2016 Yıldız et al. This work is published and licensed by Dove Medical Press Limited
The full terms of this license are available at https://www.dovepress.com/terms.php and incorporate the Creative Commons Attribution – Non Commercial (unported, v3.0) License (http://creativecommons.org/licenses/by-nc/3.0/). By accessing the work you hereby accept the Terms. Non-commercial uses of the work are permitted without any further permission from Dove Medical Press Limited, provided the work is properly attributed.
Figure 3.
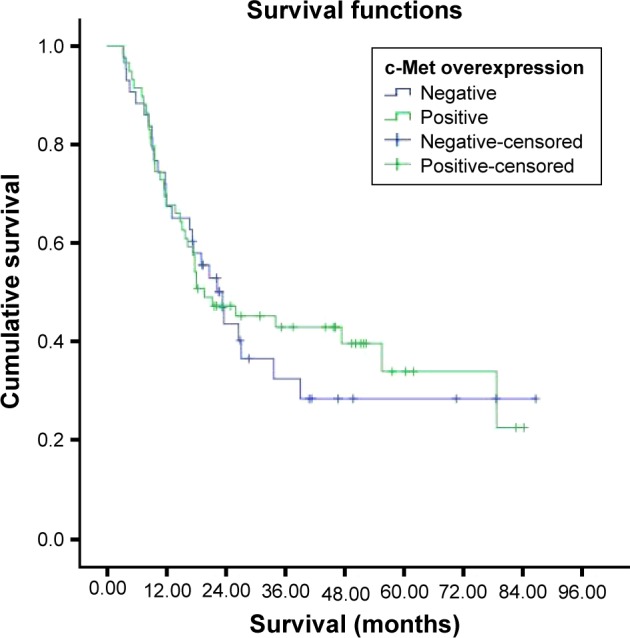
Survival curves of the patients according to c-Met expression.