Figure 2.
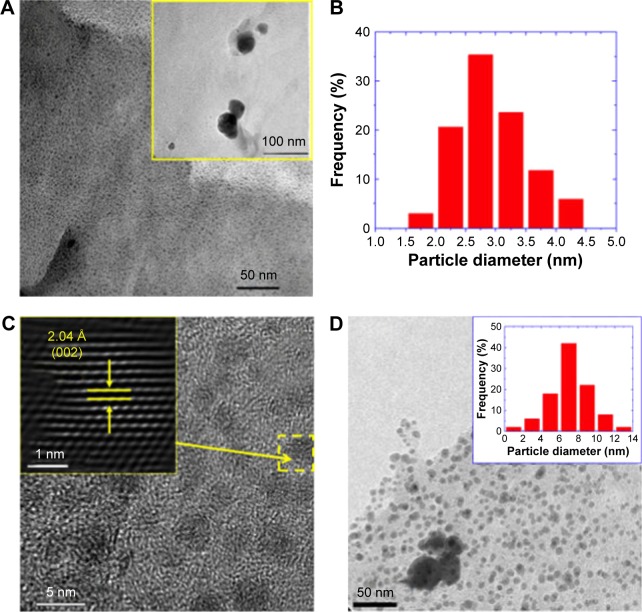
Transmission electron microscopy (TEM) studies of sample L-5mM.
Notes: (A) TEM micrograph. The inset is a low-magnification TEM image. (B) Histogram of the particle diameter distribution. (C) High-resolution TEM image. The inset is the Fourier-filtered image of the Ag nanoparticle highlighted by a dashed yellow square. The arrows and line segments in the inset indicate the interplanar distance observed in the high-resolution TEM image. (D) TEM image of the sample S-5mM. The inset shows the particle diameter distribution of this sample.
Abbreviations: L-5mM, final colloid obtained using coriander leaf extract and 5 M AgNO3; S-5mM, sample obtained using extracts of coriander seeds and 5 M AgNO3 solution.

