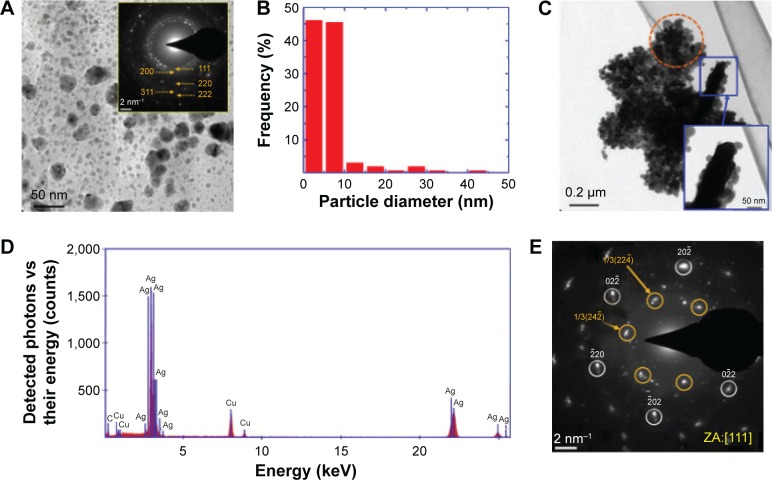
Figure 3.
TEM studies of sample L-0.5M.
Notes: (A) TEM micrograph. The inset shows the SAED pattern of the area shown in the micrograph. The orange numbers are Miller indexes and indicate the crystallographic planes associated to the observed diffraction rings. (B) Histogram of the particle diameter distribution. (C) TEM image of a nanoparticle aggregate with a branched structure. The inset shows a high magnification TEM micrograph of a branch of this aggregate. (D) EDS spectrum of the supramolecular structure observed in panel C. The traces of Cu correspond to the copper TEM grid. The trace of C is probably partially related to the presence of organic material adsorbed by the Ag nanoparticles from the coriander extract and the carbon present in the coating of the TEM grid. (E) SAED pattern of the branch of the nanoparticle aggregate highlighted by an orange circle in panel C. The numbers and / symbol – indicate Miller indexes associated to crystallographic planes; orange numbers are related to forbidden reflections and white ones to reflections expected according Bragg’s law; [ ] indicates a crystallografic direction, in this case, the zone axis.
Abbreviations: TEM, transmission electron microscope; SAED, selected-area electron diffraction; L-0.5M, final colloid obtained using coriander leaf extract and 0.5 M AgNO3; EDS, energy dispersive spectrometry; ZA, zone axis; Ag, silver; Cu, copper; C, carbon.

