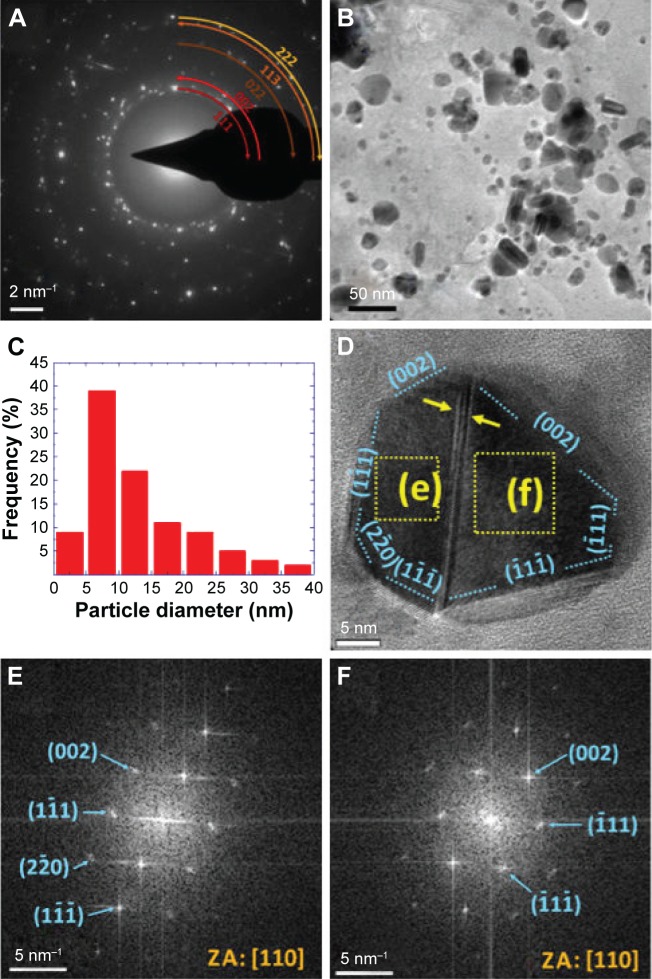
Figure 4.
(A, B) SAED pattern and TEM micrograph of sample S-0.5M, respectively. (C) Histogram of the particle diameter distribution of the same sample. (D) HRTEM image of a twinned particle. (E, F) FFT images of the areas highlighted by squares in panel D.
Notes: (D) Blue dotted lines indicate the orientation of crystallographic planes denoted with Miller indexes. The yellow arrows highlight a twinning boundary. (E and F) The blue arrows highlight diffraction spots in the SAED pattern. Numbers in parentheses indicate the corresponding crystallographic planes of metallic silver.
Abbreviations: TEM, transmission electron microscope; SAED, selected-area electron diffraction; HRTEM, high-resolution TEM; FFT, fast Fourier transform; ZA, zone axis; S-0.5M, sample obtained using extracts of coriander seeds and 0.5 M AgNO3 solution.

