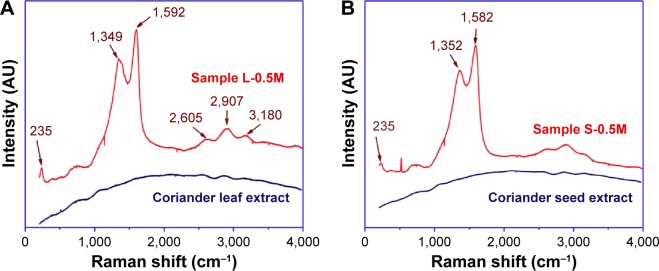
Figure 8.
Raman spectra of (A) coriander leaf extract and sample L-0.5M and (B) coriander seed extract and sample S-0.5M.
Note: Numbers indicate the position of vibrational bands.
Abbreviations: L-0.5M, final colloid obtained using coriander leaf extract and 0.5 M AgNO3; S-0.5M, sample obtained using extracts of coriander seeds and 0.5 M AgNO3 solution.

