
Figure 3.
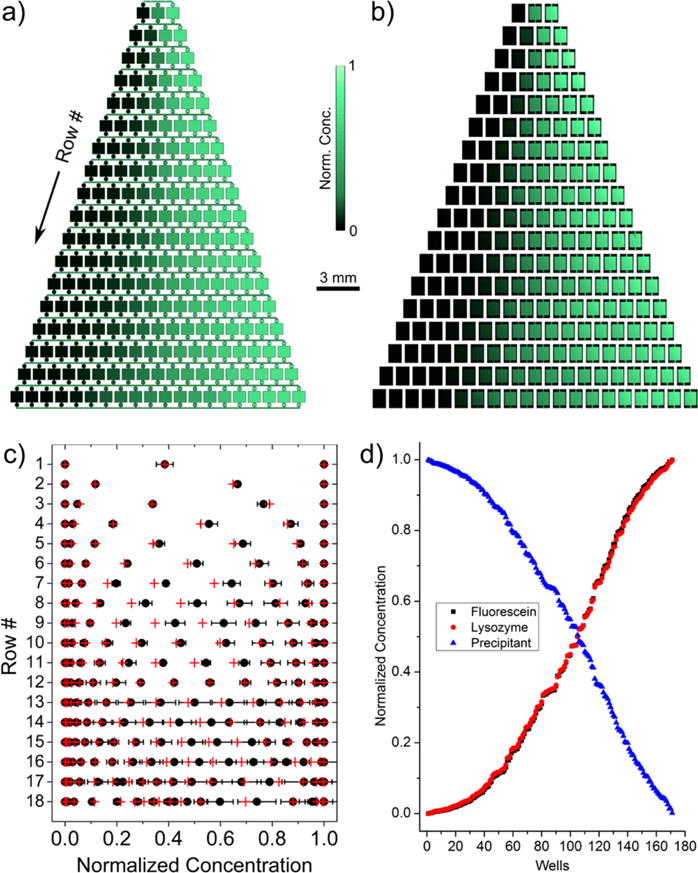
(a) Modeled concentration profile of fluorescein illustrating the gradient formed. Concentration increases from black to green. (b) Fluorescence microscopy images showing the experimental gradient of fluorescein. Brighter areas are more concentrated. (c) Quantified normalized concentrations in each well from the fluorescein dye calibration (black dots) and model (red crosses) indicating good agreement between the two. Error bars represent standard deviation for five trials and are smaller than the data point in places they are not seen. (d) Plot of quantified concentrations from the numerical model comparing the 170 unique concentrations obtained from the dye (black squares), lysozyme (red circles), and NaCl precipitant (blue triangles). The outermost control wells with no variation are omitted.