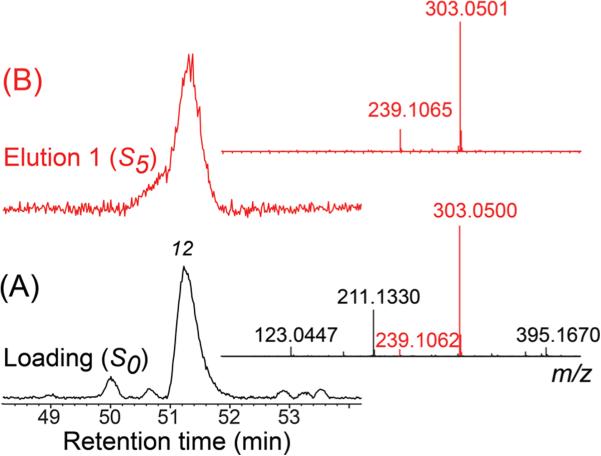
Figure 6.
Expanded (50–54 min) base peak chromatogram of crude ethyl acetate extract of E. catharinae loaded on the magnetic beads for ligand fishing (A, black) and the eluents from the fishing experiment (B, red). Inserted to the right are the corresponding MS spectra of peak 12 from the two samples.

