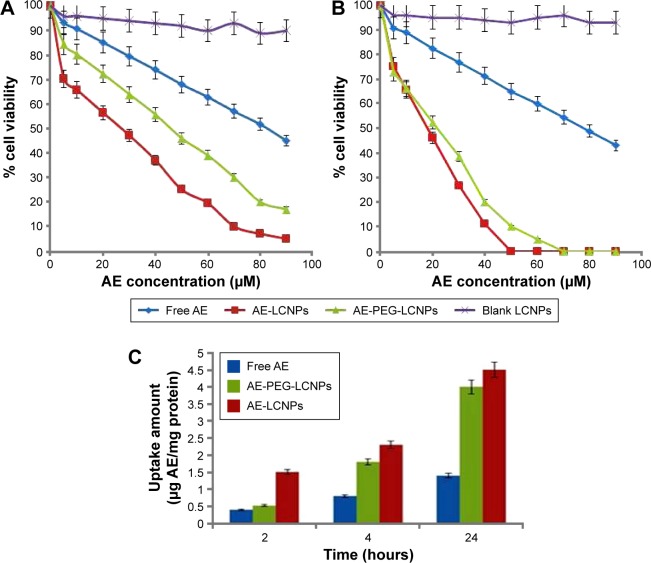
Figure 6.
Cytotoxicity analysis of free AE, AE-LCNPs, AE-PEGylated LCNPs (F13), and blank LCNPs on MCF-7 cells at the concentration of 5–90 µM after 24 hours (A) and 48 hours (B). Data are represented as mean ± SD (n=3), P<0.05. (C) Cellular uptake amount of free AE, AE-LCNPs (F6), and AE-PEG-LCNPs (F13) by MCF-7 cells at fixed AE concentration of 5 µM within 24 hours. Data are represented as mean ± SD (n=3), P<0.05.
Abbreviations: AE, aloe-emodin; LCNPs, liquid crystalline nanoparticles; PEG, polyethylene glycol; SD, standard deviation.

