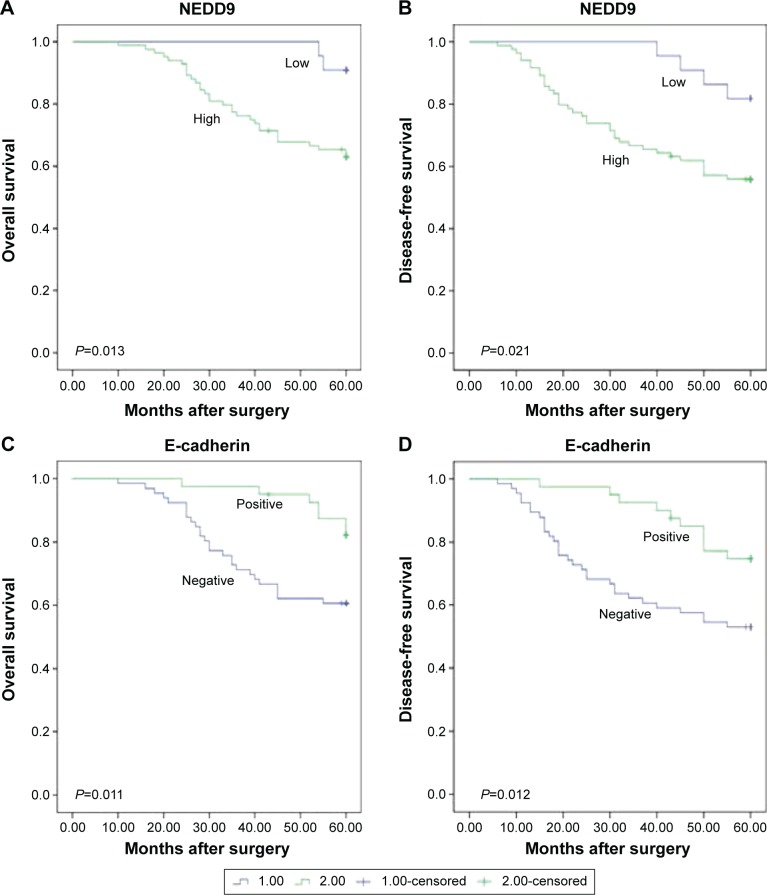
Figure 2.
Kaplan–Meier survival illustrating the significance of NEDDD9 expression in comparison with E-cadherin expression in TNBC.
Notes: (A) OS curve of the TNBC patients based on NEDD9 expression. (B) DFS curve of the TNBC patients based on NEDD9 expression. (C) OS curve of the TNBC patients based on E-cadherin expression. (D) DFS curve of the TNBC patients based on E-cadherin expression. All P<0.05.
Abbreviations: NEDD9, neural precursor cell expressed, developmentally downregulated 9; TNBC, triple-negative breast cancer.

